1. SAIC
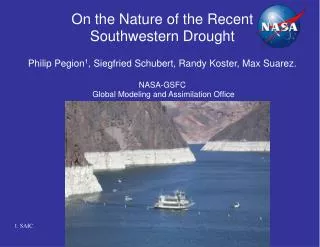
On the Nature of the Recent Southwestern Drought Philip Pegion 1 , Siegfried Schubert, Randy Koster, Max Suarez. NASA-GSFC Global Modeling and Assimilation Office. 1. SAIC. Characteristics of recent drought. Started with La Nina in 1999 5 years in a row of below normal precipitation

1. SAIC
E N D
Presentation Transcript
On the Nature of the Recent Southwestern DroughtPhilip Pegion1, Siegfried Schubert, Randy Koster, Max Suarez.NASA-GSFC Global Modeling and Assimilation Office 1. SAIC
Characteristics of recent drought • Started with La Nina in 1999 • 5 years in a row of below normal precipitation • 2002 was 4th driest year on record, the region received only 70% of normal precipitation, and in 2003, the region only received 83%. • Driest period since the 1950s. • Persisted past weak El-Nino in 2002 Motivation We want to understand the cause of the recent drought, and can we determine if it has ended?
YEAR Desert SW. region
Observed Precipitation Desert SW region. 25-month running mean anomaly (mm/day) Anomaly mm/month YEAR
Observed Precipitation Desert SW region. 25-month running mean anomaly (mm/day) Anomaly mm/month YEAR
Observed Precipitation Desert SW region. 25-month running mean anomaly (mm/day) Anomaly mm/month ENSO 2nd EOF: HADISST YEAR Correlation: 0.51
Model Description • NASA Seasonal-to-Interannual Prediction Project (NSIPP-1) AGCM • 4th Order finite difference dynamical core (Suarez and Takacs, 1995). • Simple K-scheme boundary layer (Louis et al., 1982). • Relaxed Arakawa-Schubert (RAS) convection (Moorthi and Suarez, 1992). • Chou and Suarez (1994, 2000) radiation. • Mosaic land model (Koster and Suarez, 1996). • AMIP • 3.75o longitude, 3o latitude, 34 levels • 14 member ensemble (1902-present) • Additional AMIP runs at 2o and 1o degree. • DSP • 0.625o longitude, 0.5o latitude, 34 levels • Initialized December 1, 2001 with the NCEP Reanalysis.
Precipitation Desert SW region. 25-month running mean anomaly (mm/day)
Precipitation Desert SW region (1998-2004) 7-month running mean anomaly (% of normal) CMAP Model ensemble mean
October 2001 -March 2002 Precipitation (% from normal)
October 2001 -March 2002 Surface Air Temperature Anomaly (K)
October 2001 -March 2002 200 mb Height Anomaly (m)
October 2001 -March 2002 200 mb Height Anomaly (m) Model La NINA Composite NCEP La NINA Composite
October 2001 -March 2002 850 mb v’q’ Anomaly (m s-1 g Kg-1)
High Resolution GCM runs • Initialized 00z1DEC2001 with the NCEP/NCAR reanalysis. • Run through end of March. • 10 ensemble member run over Reynolds SST • 10 additional ensemble members with MODIS SST.
DJFM 2002: SST anomaly (K) MODIS Reynolds MODIS-Reynolds
DJFM 2002: Precipitation Anomaly (mm/day) 0.5deg DSP w/ MODIS SST 0.5deg DSP w/ Reynolds SST CMAP MODIS - Reynolds
DJFM 2002: Precipitation (% of normal) 0.5deg DSP w/ Reynolds SST 0.5deg DSP w/ MODIS SST CMAP MODIS - Reynolds
DJFM 2002: 200 mb Height Anomaly (m) 0.5deg DSP w/ MODIS SST 0.5deg DSP w/ Reynolds SST NCEP/NCAR Reanalysis MODIS - Reynolds
DJFM 2002: Precipitation (% of normal) Ensemble 1 MODIS SST Ensemble 2 MODIS SST 0.5deg DSP w/ Reynolds SST Ensemble 2 Reynolds SST NCEP/NCAR Reanalysis
Has the long term drought ended, or is last winter just a bump in the time series?
Lake Powell Year Conclusions • Recent drought was of the most severe and longest lasting in recent times. • Start of drought is linked with changes in Pacific Ocean SSTs • Most severe part of drought, 2002, lies outside of the envelope of response in the model. • Some hi-resolution runs do get the correct magnitude of the winter drought. • Last winter rains provided big relief to the drought, but the southwest hasn’t recovered yet. Surface Elevation
Precipitation Desert SW region (1998-2004) 7-month running mean anomaly (mm/day) CMAP Model ensemble mean
Precipitation Desert SW region (1998-2004) 7-month running mean anomaly (normalized) CMAP Model ensemble mean