Data Analysis and Presentation
Data Analysis and Presentation. There are many “tricks of the trade” used in data analysis and results presentation A few will be mentioned here: statistical analysis multi-variate analysis ANOVA graphical/tabular presentation of results. Statistical Analysis.

Data Analysis and Presentation
E N D
Presentation Transcript
Data Analysis and Presentation • There are many “tricks of the trade” used in data analysis and results presentation • A few will be mentioned here: • statistical analysis • multi-variate analysis • ANOVA • graphical/tabular presentation of results CPSC 641 Winter 2011
Statistical Analysis • “Math and stats can be your friends!!!” CW • There are lots of “standard” techniques from mathematics, probability, and statistics that are of immense value in performance work: • confidence intervals, null hypotheses, F-tests, T-tests, linear regression, least-squares fit, maximum likelihood estimation, correlation, time series analysis, transforms, Q-Q, EM... • working knowledge of commonly-observed statistical distributions CPSC 641 Winter 2011
Multi-Variate Analysis • For in-depth and really messy data analysis, there are multi-variate techniques that can be immensely helpful • In many cases, good data visualization tools will tell you a lot (e.g., plotting graphs), but in other cases you might try things like: • multi-variate regression: find out which parameters are relevant or not for curve fitting • ANOVA: analysis of variance can show the parameters with greatest impact on results CPSC 641 Winter 2011
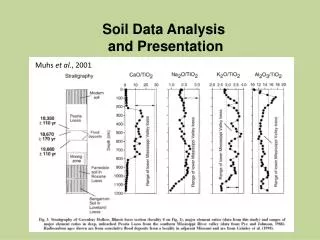
Presentation of Results • Graphs and tables are the two most common ways of illustrating and/or summarizing data • graphs can show you the trends • tables provide the details • There are good ways and bad ways to do each of these • Again, it is a bit of an “art”, but there are lots of good tips and guidelines as well CPSC 641 Winter 2011
Table Tips • Decide if a table is really needed; if so, should it be part of main paper, or just an appendix? • Choose formatting software with which you are familiar; easy to import data, export tables • Table caption goes at the top • Clearly delineate rows and columns (lines) • Logically organize rows and columns • Report results to several significant digits • Be consistent in formatting wherever possible CPSC 641 Winter 2011
Graphing Tips (1 of 2) • Choose a good software package, preferably one with which you are familiar, and one for which it is easy to import data, export graphs • Title at top; caption below (informative) • Labels on each axis, including units • Logical step sizes along axes (10’s, 100’s…) • Make sure choice of scale is clear for each axis (linear, log-linear, log-log) • Graph should start from origin (zero) unless there is a compelling reason not to do so CPSC 641 Winter 2011
Graphing Tips (2 of 2) • Make judicious choice of type of plot • scatter plot, line graph, bar chart, histogram • Make judicious choice of line types • solid, dashed, dotted, lines and points, colours • If multiple lines on a plot, then use a key, which should be well-placed and informative • If graph is “well-behaved”, then organize the key to match the lines on the graph (try it!) • Be consistent from one graph to the next wherever possible (size, scale, key, colours) CPSC 641 Winter 2011
Summary • There are many “tricks of the trade” used in data analysis and presentation • A few have been mentioned here • Effective data analysis and presentation is important in an effective performance evaluation study • Not always easy to do, but it is worth it! CPSC 641 Winter 2011