Download
1 / 54
720 likes | 1.34k Vues
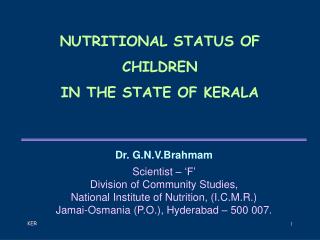
NUTRITIONAL STATUS OF CHILDREN IN THE STATE OF KERALA. Dr. G.N.V.Brahmam Scientist – ‘F’ Division of Community Studies, National Institute of Nutrition, (I.C.M.R.) Jamai-Osmania (P.O.), Hyderabad – 500 007. HEALTH AND NUTRITION. HEALTH

E N D
NUTRITIONAL STATUS OF CHILDREN IN THE STATE OF KERALA Dr. G.N.V.Brahmam Scientist – ‘F’ Division of Community Studies, National Institute of Nutrition, (I.C.M.R.) Jamai-Osmania (P.O.), Hyderabad – 500 007.
HEALTH AND NUTRITION HEALTH “… is a state of complete physical, mental, and social well being and not merely absence of disease or infirmity” - - - WHONUTRITION “ … is a process of ingestion of food, digestion, absorption, assimilation, and utilization of various nutrients”
SIGNIFICANCE OF NUTRITION • Normal Growth, development and functions • Epidemiological data reveals strong association between undernutrition and morbidity & mortality. • Chronic degenerative disorders such as, - Coronary heart disease, - Hypertension, - Type 2 Diabetes, - certain types of Cancers, etc. are associated to diet and nutritional status • Undernutrition in early Childhood is associated with chronic degenerative disorders in later life
SIGNIFICANCE OF NUTRITION (Contd.) • Consumption of foods rich in dietary fiber, anti- oxidants is associated with reduced risk of certain types of cancer. • Obesity and overweight is also associated with Increased risk of developing cancer of the Breast, Colon, Endometrium, Gallbladder, Oesophagus, Pancreas, Kidney, etc.
MALNUTRITION “ ….. a pathological state that results from ingestion of one or more nutrients, either in excess or deficient quantities over a period of time.” Undernutrition : Due to deficient intakesOvernutrition : Due to excess intakes
HOUSEHOLD FOOD SECURITY: Ability of the Household to access food which is culturally acceptable and adequate in terms of quality, quantity and safety for all members of the household throughout the year, in order to ensure active and healthy life
Demographic factors Agro-climatic factors Disasters Socio-economic factors DETERMINANTS OF NUTRITIONAL STATUS • Population • Family Size • Urbanisation Drought/Floods Wars • Food production • Land Ownership • Type of land • Rain fall • Geographic conditions • Agricultural techniques • Use of hybrid seeds • Use of fertilizers • Religion • Community • Occupation • Income H H FOOD SECURITY Availability of & participation in developmental programmes Physiological factors • Pregnancy • Lactation • Breast feeding practices • Infant & child Feeding practices FOOD INTAKE • PDS • Rural Dev. Prog. • Employment • generation prog. Socio-cultural factors • Illiteracy • Ignorance • Taboos • Lifestyles NUTRITIONAL STATUS Pathological Conditions • Infections • Diarrhoeas • Resp. Infections • Malaria • Others • Infestations • Hook worms • Round worms • Giardiasis etc., Environmental factors • Environmental sanitation • Personal hygiene • Safe drinking water
HEALTH & ECONOMIC CONSEQUENCES OF MALNUTRITION • Increased Morbidities, cost of treatment • Underdevelopment (Physical / Mental) • Absenteeism, Reduced productivity, lowered economic development
INFECTION AND UNDERNUTRITION ….. a Vicious Cycle INFECTION Reduced Food intake/ absorption Lowered resistance/ Frequent infections Death UNDERNUTRITION
CAUSES OF DEATHS AMONG <5 YEAR CHILDREN IN DEVELOPING COUNTRIES * * * Malnutrition* 60% * Approximately 70% of all childhood deaths are associated with one or more of these five conditions * Source: WHO 2002; Lancet-2003
Infant Mortality Rate (Per 1000 Live Births) in India and South-east Asian Countries 44 (SRS-2011) Source : WHO/SEARO2000 * Source: SRS-2011 11
Under-five Mortality Rate (Per 1000 Live Births) in South-east Asian Countries & India (55: SRS, 2011) (2002) (2004) (2000) (2003-04) (1999-2000) * Source: SRS, 2011
IMR & UNDER-FIVE MORTALITY RATE : URBAN Vs RURAL(Source: SRS – 2011)
Maternal Mortality Ratio (Per 100,000 Live Births) in India and South-east Asian Countries 212* Source : WHO/SEARO 2000 * Registrar General of India, SRS - 2011
Prevalence (%) of Low Birth Weight in India and South-east Asian Countries Source : WHO/SEARO 2000 * Source: NFHS 3
PERECNT CHILDREN (12-23 MONTHS) COMPLETELY IMMUNIZED INDIA KERALA
Percent Age (Months) Faulty BF Faulty Complementary feeding * By using Harvard Reference Values Prevalence of Underweight among 6-59 months children according to age* ( by IAP classification)
INFANT AND YOUNG CHILD FEEDING PRACTICES (NFHS 3) India Percent Percent Kerala
Average Daily Consumption (per CU/day) of Foodstuffs as % of RDA : Kerala Vs Other NNMB States Pooled RDA Source: NNMB Survey, 2005-06 ( 8 States) NNMB
Median Intake (per CU/Day) of Various Nutrients (as % of RDA): Kerala Vs Other NNMB States Pooled RDA Source: NNMB Survey, 2005-06 ( 8 States) NNMB
Average Daily intake of Foodstuffs (as % RDA) among 1-6 Year Children : Kerala RDA Percent of RDA Source: NNMB Survey, 2005-06
Median Intake of Nutrients (as % RDA) by 1-6 year Children : Kerala RDA Percent of RDA Source: NNMB Survey, 2005-06
Protein-Calorie inadequacy status of Children : Kerala Calorie inadequacy Protein inadequacy Source: NNMB Survey, 2005-06
Distribution (%) of Households According to Dietary Energy Adequacy Status of Adults and Children In Kerala Source: NNMB Survey, 2005-06
FOOD & NUTRIENT INTAKES IN KERALA . . . TIME TRENDS
Average Intake of Foodstuffs (per CU/day) in Kerala as % of RDI by Period of Survey (NNMB) RDA Percent
Median Intake of Nutrients (per CU/day) in Kerala as % of RDI by Period of Survey (NNMB) RDA Percent
Median Intake of Nutrients (per CU/day) in Kerala as % of RDI by Period of Survey (NNMB) RDA Percent
Prevalence (%) of Undernutrition Among 0-5 yr children According to SD Classification (<Median - 2SD)in Kerala* Percent (Weight for Height) (Weight for age) (Height for age) Source: NNMB Survey, 2005-06 * Using WHO Child Growth Standards
Prevalence (%) of Undernutrition among <5 yr Children – By State (2006) By SD Classification UNDERWEIGHT STUNTING WASTING * Using WHO Child Growth Standards
Prevalence (%) of Undernutrition Among 1-5 yr children According to SD Classification (<Median - 2SD) in Kerala : By Age Group (Years) P>0.05 Percent Source: NNMB Survey, 2005-06 ( 8 States) NNMB * Using WHO Child Growth Standards
Prevalence (%) of Undernutrition Among <3 yr children According to SD Classification (<Median - 2SD) in Kerala : RURAL Vs URBAN (NFHS 3) Percent Source: NFHS 3 * Using WHO Child Growth Standards
Prevalence (%) of Undernutrition Among 6-9 yr children According to SD Classification* Percent Source: NNMB Survey, 2005-06 * Using NCHS Reference Values
Prevalence (%) of Undernutrition Among Adolescent children According to BMI (Age/Sex Centile values of NHANES) Percent Source: NNMB Survey, 2005-06
Prevalence (%) of Overweight/Obesity among 6-15 yr urban children in Kochi City (Based on Age/Sex specific Centile values of BMI: WHO/CDC)[Overweight: BMI 85th – 95th Centile; Obese: BMI: >=95th Centile; ; Overweight+ Obese: BMI >= 85th Centile] P<0.028 Percent BOYS GIRLS P<0.005 P<0.005 Percent Percent Source: A.T.Cherian, Ind. Ped. 2012
Distribution (%) of Adult Men and Women According to Nutritional Status by BMI Percent Source: NNMB Survey, 2005-06
Distribution (%) of 1- 5 Yr. Children with Blood Vit. A Levels of < 20 G/dL, Median Dietary Intake of Vit. A (as % RDA) and Extent of Coverage for Suppl. of Massive Dose Vit. A – By State Source:NNMB Tech. Rep. #23 - 2005
Distribution (%) of 1-5 year Children according to Vitamin ‘A’ Status : By States Blood Vitamin A < 20 g/dL Dietary Vitamin A Intake < 50% of RDA P > 0.05 P > 0.05 Receipt of Massive Dose Vitamin A (1 or 2 Doses) Source: NNMB-MND Survey, 2003 (8 States)
Prevalence (%) of Anaemia Among Different Age, Sex and Physiological Groups in Kerala 11.4 0.07 11.8 0.07 10.9 0.08 10.7 0.07 11.8 0.07 10.2 1.45 12.1 1.56 Mean ±SE > 6 months < 6 months Source: NNMB-MND Survey, 2003 (8 States)
Distribution (%) of Target Beneficiaries according to receipt of IFA tablets in Kerala Source: NNMB-MND Survey : 8 States, 2003
Percent of Households consuming salt having adequate Amount (>=15 ppm) of Iodine in Kerala Per cent STATES * By spot test Source: NNMB-MND Survey : 8 States, 2003
Challenges: • Despite the positive improvements in the demographic, socio-economic and health sectors, the dietary intakes of the rural communities continues to be poor both in terms of quantity and quality. • Dietary intake of energy is low and that of essential micronutrients are grossly inadequate. • Infant and child feeding practices, especially during the first 6 months, are sub-optimal • Prevalence of LBW is about 16%, and about 22% of <5 year children are underweight and 30% are stunted and 15% are wasted
Challenges (contd..): • About 28% of the men and 21% of the women are having CED. • MNDs such as IDA and VAD continue to be of public health significance and coverage of target groups for IFA & Vit A distribution is low. • About a third of men and 40% of women are having overweight/obesity among adults known risk factors for diet related chronic degenerative diseases such as type 2 diabetes, hypertension and CHD. • Nearly one half of adult population are found to be having hypertension.
Possible Solutions: • Devise and implement appropriate IEC strategies to improve the knowledge and practices among the community, about infant and young child feeding. • Encourage the communities to include locally available micronutrient rich foods such as green leafy vegetables, and fruits in their regular diets through Agri. / Horti. interventions. • Strengthening of on-going programmes to increase the coverage of target beneficiaries for Supplementary nutrition and distribution of folifer tablets and massive dose vitamin A