Download
1 / 1
10 likes | 104 Vues
The Relationship Between Suboptimal Serum 25-Hydroxyvitamin D and Cystic Fibrosis Related Diabetes

E N D
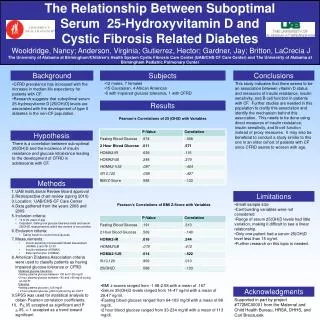
The Relationship Between Suboptimal Serum 25-Hydroxyvitamin D and Cystic Fibrosis Related Diabetes Wooldridge, Nancy; Anderson, Virginia; Gutierrez, Hector; Gardner, Jay; Britton, LaCrecia JThe University of Alabama at Birmingham/Children’s Health System Cystic Fibrosis Care Center (UAB/CHS CF Care Center) and The University of Alabama at Birmingham Pediatric Pulmonary Center Background Subjects Conclusions • 12 males, 7 females • 15 Caucasian, 4 African American • 5 with impaired glucose tolerance, 1 with CFRD • This study indicates that there seems to be an association between vitamin D status and measures of insulin resistance, insulin sensitivity, and B-cell function in patients with CF. Further studies are needed in this population to clarify this association and identify the mechanism behind this association. This needs to be done using direct measures of insulin resistance, insulin sensitivity, and B-cell function instead of proxy measures. It may also be beneficial to conduct a study similar to this one in an older cohort of patients with CF since CFRD seems to worsen with age. • CFRD prevalence has increased with the increase in median life expectancy for patients with CF. • Research suggests that suboptimal serum 25-hydroxyvitamin D [25(OH)D] levels are associated with the development of type II diabetes in the non-CF population. Results Pearson’s Correlations of 25 (OH)D with Variables Hypothesis There is a correlation between sub-optimal 25(OH)D and the incidence of insulin resistance and glucose intolerance leading to the development of CFRD in adolescents with CF. Methods • UAB Institutional Review Board approval • Retrospective chart review (spring 2010) • Location: UAB/CHS CF Care Center • Data gathered from the years 2008 and 2009 • Inclusion criteria: • 14 to 20 years of age • Outpatient, fasting oral glucose tolerance tests and serum 25(OH)D measurements within two months of one another • Exclusion criteria: • Taking insulin to control blood glucose • Measurements: • Insulin sensitivity Homeostatic Model Assessment (HOMA) 2 and ISI 0,120 • Insulin resistance (HOMA2) • Beta cell function (HOMA2) • American Diabetes Association criteria were used to classify patients as having impaired glucose tolerance or CFRD. • Impaired glucose tolerance: • fasting plasma glucose between 100 and 125 mg/dl • 2 hour plasma glucose between 140 and 199 mg/dl during an OGTT • Diabetes • fasting plasma glucose >126 mg/dl • 2 hour plasma glucose >200 mg/dl during an OGTT • 9.SPSS was used for statistical analysis to obtain Pearson correlation coefficients. • 10. P<.05 accepted as significant and P >.05, <.1 accepted as a trend toward significant Limitations • Small sample size • Confounding variables were not considered • Range of serum 25(OH)D levels had little variation, making it difficult to see a linear relationship. • Only one patient had a serum 25(OH)D level less than 15 ng/ml. • Further research on this topic is needed. Pearson’s Correlations of BMI Z-Score with Variables • BMI z-scores ranged from -1.98-2.58 with a mean of .167 • Serum 25(OH)D levels ranged from 14-47 ng/ml with a mean of 29.47 ng/ml. • Fasting blood glucose ranged from 64-109 mg/dl with a mean of 88 mg/dl. • 2 hour blood glucose ranged from 33-234 mg/dl with a mean of 113 mg/dl. Acknowledgments Supported in part by project #T72MC00001 from the Maternal and Child Health Bureau, HRSA, DHHS, and Carl Brezausek.