Climate Simulation Data for Stockholm: Temperature and Precipitation Analysis until 2100
This dataset encompasses climate simulations for Stockholm, detailing temperature and precipitation from the years 1000 to 2100. It includes monthly mean precipitation data in mm/day, allowing for detailed analysis of climate trends over more than a millennium. The dataset is structured for comparisons between scenarios A2 and B2, enabling a comprehensive assessment of climate change impacts. Suggested exercises within the dataset prompt users to calculate trends, seasonal changes, and correlations, aiding understanding of historical and future climate dynamics.

Climate Simulation Data for Stockholm: Temperature and Precipitation Analysis until 2100
E N D
Presentation Transcript
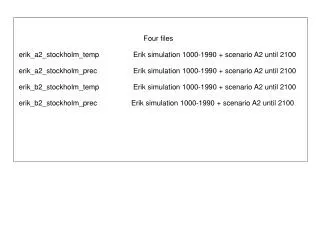
Four files erik_a2_stockholm_temp Erik simulation 1000-1990 + scenario A2 until 2100 erik_a2_stockholm_prec Erik simulation 1000-1990 + scenario A2 until 2100 erik_b2_stockholm_temp Erik simulation 1000-1990 + scenario A2 until 2100 erik_b2_stockholm_prec Erik simulation 1000-1990 + scenario A2 until 2100
File estructure ERIK1 plus scenario A2 Stockholm monthly mean precipitation (mm/day) yyyy Jan Feb Mar Apr May Jun Jul Aug Sep Oct Nov Dec 1000 4.49 3.42 2.61 1.66 2.47 2.36 0.38 1.41 3.57 4.52 5.21 3.55 1001 4.08 3.95 1.80 1.63 1.63 1.90 1.81 2.76 3.65 4.77 2.77 4.98 1002 3.80 2.96 3.30 3.04 2.14 1.34 0.91 0.66 1.98 2.52 5.47 3.20 1003 2.99 4.53 3.59 2.59 1.79 1.77 0.95 0.74 2.62 4.16 3.57 2.61 1004 2.46 1.72 2.40 1.72 2.30 2.18 2.09 5.10 3.91 3.91 3.02 3.58 1005 3.75 3.06 2.82 3.02 2.62 1.24 0.62 1.86 1.80 2.95 5.16 5.79 1006 3.56 1.95 2.71 2.11 1.51 0.56 1.93 1.14 2.72 3.15 3.90 3.52 1007 2.79 3.50 1.91 2.49 1.46 1.48 1.04 2.87 2.09 4.11 3.52 2.39 1008 4.04 2.58 2.14 1.18 0.62 1.18 1.35 1.92 3.84 4.29 4.63 5.26 1009 3.25 2.75 2.17 2.18 0.91 1.12 0.88 1.82 3.85 3.79 4.22 3.46 1010 4.42 3.26 2.73 2.31 1.81 1.66 0.49 0.90 4.43 4.07 3.73 3.72 1011 3.33 3.40 2.55 2.34 2.82 1.66 0.86 1.35 3.65 5.49 4.01 4.41 1012 3.64 4.85 2.42 2.38 2.61 0.58 0.90 1.68 2.76 4.56 3.59 3.63 1013 4.02 2.21 3.21 1.96 1.06 1.35 1.24 1.61 2.55 5.28 4.34 3.42 1014 3.26 3.06 3.65 1.30 0.74 1.03 1.43 1.35 2.28 3.75 4.98 4.71 1015 2.50 4.23 1.85 1.40 0.81 1.56 0.28 2.18 3.55 3.03 2.84 3.81 1016 3.70 3.26 1.96 2.11 1.41 0.36 1.84 0.47 2.61 2.60 3.69 3.62 1017 3.30 2.15 2.58 1.82 1.94 1.22 1.02 2.41 2.42 4.99 4.94 3.74 ........ ........
Suggested exercises 1. Calculate and plot the timeseries of summer (Jun-Jul-Aug) and winter (Dec-Jan-Feb) for T and Prec, for both scenarios A2 and B2 2. Calculate, for summer and winter separately, the temperature and precipitation change in the last 10 years of the simulation with respect to the preindustrial mean, in both scenarios A2 and B2: mean of 2090-2100 minus mean 1000-1800 3. Smooth the time series with a 31-year running mean (or other filter, e.g. Gaussian mean), and calculate the correlation between summer T and summer Prec, and between winter T and winter Prec, in the period 1000-1800 4. Calculate the linear trend of T and Prec in the period 2000-2100 for both scenarios A2 and B2, and their 95% confidence intervals. Use the unsmoothed series. (Excel can calculate linear trends).