Predicted VO 2 max
Predicted VO 2 max. Maximal Oxygen Consumption. What is it & Why measure it ? Greatest volume of oxygen that the body can consume per unit time Regarded as “gold standard” of aerobic fitness Can be measured directly or estimated by use of prediction tests. Direct Measurement Used for :

Predicted VO 2 max
E N D
Presentation Transcript
Maximal Oxygen Consumption What is it & Why measure it ? • Greatest volume of oxygen that the body can consume per unit time • Regarded as “gold standard” of aerobic fitness • Can be measured directly or estimated by use of prediction tests
Direct Measurement Used for: Research Development of regression equations Why: Accuracy Predictions Used for: At risk population Large field test Personal training Why: Less Cost Equipment Training Of Running each Test Less Time Less Risk of Injury Because the test is submaximal Direct Measurements vs. Predictions
Regression Equations(Where do these prediction equations come from? • Large homogeneous sample populations • College students, adults aged 30-45, >65 • Start with numerous variables • e.g. Age, height, weight, sex, HR, lung capacity, MVC, anaerobic capacity, sub max VO2,work load • Determine which variable (or combination of variables) best predicts VO2max
Regression Equations for VO2max Prediction • Some prediction tests: • Are based on recovery HR after a specific submaximal exercise test relates to VO2 max • Are related to speed in a running test compared to VO2 max • Include workload and HR • Equations usually differ based on gender and age • Equations can either predict to a relative or absolute value
A Word of Caution in Predictions • All prediction tests contain error known as the standard error of estimate (SEE) • SEE are expressed in measurement units used for prediction or as a percentage • Smaller SEE means the test is more useful • Closely related to R2 value
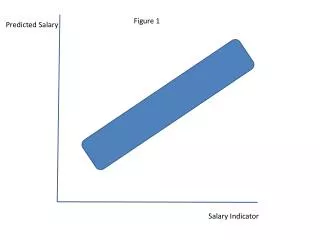
Why Are Predictions Based on HR? • Data was gathered at several workloads • HR plotted vs. VO2 • A line of best fit is extended through predicted max HR for each person. • Each person showed a very good R2 but slopes of the lines differed for different people based on fitness level
From HR to Regression Equations • After recognizing the relationship between VO2 and HR 1.several people performed standardized exercise regimens and recorded submax HR 2.These people also performed a true max test 3.Then Their VO2 max was plotted vs submax HR (sometimes other variables were included) the equation of this line is used to predict VO2 max from the submax HR (the SEE is related to the R2 value of this line).
Forestry Step Test • Variables • Recovery Heart Rate • Step frequency • Procedure • Step up and down from a chair for 5 min at a set cadence (90 b/min or 22.5/min step rate) • Measure HR from 15-30 seconds after completion • Analysis • Calculate relative VO2 max from a regression equation • Accuracy • SEE is 12-15%
Astrand Cycle Test • Variables • Heart Rate • Load • Revolutions/Minute • Body Mass • Procedure • Subject rides for 6 min at target zone (table 14.2)-- 50rpm 2.5kg women, 3.0kg men • Load adjusted at 3 min if target zone not likely to be achieved • Analysis • Calculate power from load and rpm • Estimate absolute VO2 submax and max using an equation • Calculate Relative VO2 max