Download

1 / 64
720 likes | 1.09k Vues
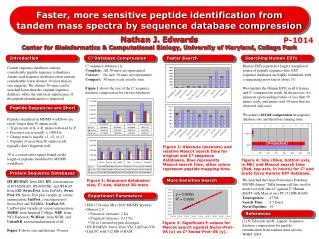
Statistical Significance for Peptide Identification by Tandem Mass Spectrometry. Nathan Edwards Center for Bioinformatics and Computational Biology University of Maryland, College Park. Mass Spectrometry for Proteomics. Measure mass of many (bio)molecules simultaneously High bandwidth

E N D
Statistical Significance for Peptide Identification by Tandem Mass Spectrometry Nathan Edwards Center for Bioinformatics and Computational Biology University of Maryland, College Park
Mass Spectrometry for Proteomics • Measure mass of many (bio)molecules simultaneously • High bandwidth • Mass is an intrinsic property of all (bio)molecules • No prior knowledge required
Mass Spectrometry for Proteomics • Measure mass of many molecules simultaneously • ...but not too many, abundance bias • Mass is an intrinsic property of all (bio)molecules • ...but need a reference to compare to
100 % Intensity 0 m/z 250 500 750 1000 High Bandwidth
Mass Spectrometry for Proteomics • Mass spectrometry has been around since the turn of the century... • ...why is MS based Proteomics so new? • Ionization methods • MALDI, Electrospray • Protein chemistry & automation • Chromatography, Gels, Computers • Protein sequence databases • A reference for comparison
Enzymatic Digest and Fractionation Sample Preparation for Peptide Identification
Single Stage MS MS m/z
Tandem Mass Spectrometry(MS/MS) m/z Precursor selection m/z
Tandem Mass Spectrometry(MS/MS) Precursor selection + collision induced dissociation (CID) m/z MS/MS m/z
Peptide Fragmentation Peptides consist of amino-acids arranged in a linear backbone. N-terminus H…-HN-CH-CO-NH-CH-CO-NH-CH-CO-…OH Ri-1 Ri Ri+1 C-terminus AA residuei-1 AA residuei AA residuei+1
yn-i bi Peptide Fragmentation yn-i-1 -HN-CH-CO-NH-CH-CO-NH- CH-R’ Ri i+1 R” i+1 bi+1
Peptide: S-G-F-L-E-E-D-E-L-K MW ion ion MW 88 b1 S GFLEEDELK y9 1080 145 b2 SG FLEEDELK y8 1022 292 b3 SGF LEEDELK y7 875 405 b4 SGFL EEDELK y6 762 534 b5 SGFLE EDELK y5 633 663 b6 SGFLEE DELK y4 504 778 b7 SGFLEED ELK y3 389 907 b8 SGFLEEDE LK y2 260 1020 b9 SGFLEEDEL K y1 147 Peptide Fragmentation
Peptide Fragmentation 88 145 292 405 534 663 778 907 1020 1166 b ions S G F L E E D E L K 1166 1080 1022 875 762 633 504 389 260 147 y ions 100 % Intensity 0 m/z 250 500 750 1000
Peptide Fragmentation 88 145 292 405 534 663 778 907 1020 1166 b ions S G F L E E D E L K 1166 1080 1022 875 762 633 504 389 260 147 y ions y6 100 y7 % Intensity y5 b3 b4 y2 y3 b5 y8 y4 b8 y9 b6 b7 b9 0 m/z 250 500 750 1000
Peptide Identification • For each (likely) peptide sequence 1. Compute fragment masses 2. Compare with spectrum 3. Retain those that match well • Peptide sequences from protein sequence databases • Swiss-Prot, IPI, NCBI’s nr, ... • Automated, high-throughput peptide identification in complex mixtures
Peptide Identification • Peptide fragmentation by CID is poorly understood • MS/MS spectra represent incomplete information about amino-acid sequence • I/L, K/Q, GG/N, … • Correct identifications don’t come with a certificate!
Peptide Identification • High-throughput workflows demand we analyze all spectra, all the time. • Spectra may not contain enough information to be interpreted correctly • …bad static on a cell phone • Peptides may not match our assumptions • …its all Greek to me • “Don’t know”is an acceptable answer!
Peptide Identification • Rank the best peptide identifications • Is the top ranked peptide correct?
Peptide Identification • Rank the best peptide identifications • Is the top ranked peptide correct?
Peptide Identification • Rank the best peptide identifications • Is the top ranked peptide correct?
Peptide Identification • Incorrect peptide has best score • Correct peptide is missing? • Potential for incorrect conclusion • What score ensures no incorrect peptides? • Correct peptide has weak score • Insufficient fragmentation, poor score • Potential for weakened conclusion • What score ensures we find all correct peptides?
Statistical Significance • Can’t prove particular identifications are right or wrong... • ...need to know fragmentation in advance! • A minimal standard for identification scores... • ...better than guessing. • p-value, E-value, statistical significance
Throwing darts One at a time Blindfolded Uniform distribution? Independent? Identically distributed? Pr [ Dart hits 20 ] = 0.05 Probability Concepts
Probability Concepts Throwing darts • One at a time • Blindfolded • Three darts Pr [Hitting 20 3 times] = 0.05 * 0.05 * 0.05 Pr [Hit 20 at least twice] = 0.007125 + 0.000125
Probability Concepts Throwing darts • One at a time • Blindfolded • 100 darts Pr [Hitting 20 3 times] = 0.139575 Pr [Hit 20 at least twice] = 0.9629188
Match Score • Dartboard represents the mass range of the spectrum • Peaks of a spectrum are “slices” • Width of slice corresponds to mass tolerance • Darts represent • random masses • masses of fragments of a random peptide • masses of peptides of a random protein • masses of biomarkers from a random class • How many darts do we get to throw?
100 % Intensity 0 m/z 250 500 750 1000 Match Score What is the probability that we match at least 5 peaks? 270 330 870 550 755 580
Match Score • Pr [ Match ≥ s peaks ] = Binomial( p , n ) ≈ Poisson( p n ), for small p and large n p is prob. of random mass / peak match, n is number of darts (fragments in our answer)
Match Score Theoretical distribution • Used by OMSSA • Proposed, in various forms, by many. • Probability of random mass / peak match • IID (independent, identically distributed) • Based on match tolerance
Match Score Theoretical distribution assumptions • Each dart is independent • Peaks are not “related” • Each dart is identically distributed • Chance of random mass / peak match is the same for all peaks
Tournament Size 100 people 1000 people 100 Darts, # 20’s 100000 people 10000 people
Tournament Size 100 people 1000 people 100 Darts, # 20’s 100000 people 10000 people
Number of Trials • Tournament size == number of trials • Number of peptides tried • Related to sequence database size • Probability that a random match score is ≥ s • 1 – Pr [ all match scores < s ] • 1 – Pr [ match score < s ] Trials (*) • Assumes IID! • Expect value • E = Trials * Pr [ match ≥ s ] • Corresponds to Bonferroni bound on (*)
Better Random Models • Comparison with completely random model isn’t really fair • Match scores for real spectra with real peptides obey rules • Even incorrect peptides match with non-random structure!
Better Random Models • Want to generate random fragment masses (darts) that behave more like the real thing: • Some fragments are more likely than others • Some fragments depend on others • Theoretical models can only incorporate this structure to a limited extent.
Better Random Models • Generate random peptides • Real looking fragment masses • No theoretical model! • Must use empirical distribution • Usually require they have the correct precursor mass • Score function can model anything we like!
Better Random Models Fenyo & Beavis, Anal. Chem., 2003
Better Random Models Fenyo & Beavis, Anal. Chem., 2003
Better Random Models • Truly random peptides don’t look much like real peptides • Just use peptides from the sequence database! • Caveats: • Correct peptide (non-random) may be included • Peptides are not independent • Reverse sequence avoids only the first problem
Extrapolating from the Empirical Distribution • Often, the empirical shape is consistent with a theoretical model Geer et al., J. Proteome Research, 2004 Fenyo & Beavis, Anal. Chem., 2003
False Positive Rate Estimation • Each spectrum is a chance to be right, wrong, or inconclusive. • How many decisions are wrong? • Given identification criteria: • SEQUEST Xcorr, E-value, Score, etc., plus... • ...threshold • Use “decoy” sequences • random, reverse, cross-species • Identifications must be incorrect!