

BACKGROUND
E N D
Presentation Transcript
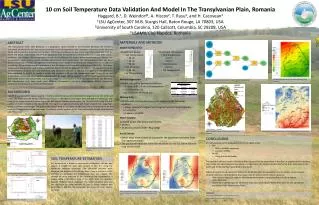
75 % ABSTRACT 99% 10 cm Soil Temperature Data Validation And Model In The Transylvanian Plain, RomaniaHaggard, B.1, D. Weindorf1, A. Hiscox2, T. Rusu3, and H. Cacovean31LSU AgCenter, 307 M.B. Sturgis Hall, Baton Rouge, LA 70803, USA2University of South Carolina, 120 Callcott, Columbia, SC 29208, USA3USAMV, Cluj-Napoca, Romania Scree plot with months as variables. Scree plot with sites as variables. Euclidean distance map of the Transylvanian Plain, Romania. 10 cm soil temperature estimation model in ArcGIS ModelBuilder. MATERIALS AND METHODS • Missing Data • Months with missing data were estimated using the following equation • Temp= (mo)(mo*mo)(mo*mo*mo)(mo*mo*mo*mo)(site)(year) • r2 = 0.9775 • p-value = < 0.0001 Station Configuration • 10 with rain gauges • Soil Temperature: • 10 cm • 30 cm • 50 cm • Soil Moisture: • 10 cm • Air Temperature • 10 without rain gauges • Soil Temperature: • 10 cm • 50 cm • Soil Moisture: • 10 cm • Air Temperature The Transylvanian Plain (TP), Romania, is a geographic region located in north-central Romania; the terrain is composed of rolling hills with tree covered summits and is surrounded by the Carpathian mountains to the East and South and the Apuseni mountains to the West. The Someş and Mureş are two major rivers that border the TP to the North and South, respectively. The TP is an agronomic area of importance in Romania for corn, sugar beet, potato, sunflower, and soybean. Soil temperature is known to be influenced by several different environmental factors such as: elevation, slope, texture, aspect, latitude, and distance from a water body. This study evaluated how well these factors influenced a monthly averaged 10 cm soil temperature model in the TP. A factor analysis was run on sites and months for 10 cm moisture and temperature at the 20 stations for 15 months ranging from 2009-2010. The factor results were interpolated using a spline method to look at similarities between the factors. The significance of the aforementioned variables was also evaluated using backward selection in SAS 9.2. The significant variables were then evaluated in ArcGIS to create a model and produce a 10 cm soil temperature map. Using 50 cm soil temperature, soil temperature regimes were found to be mesic, with a mean of 10.98oC. Pedon descriptions have been made at each site location with subsequent taxonomic classification in both U.S. Soil Taxonomy and Romanian Soil Classification. Soils have mostly been Mollisols (Cernosoluri), and to a lesser extent, Alfisols (Luvisoluri), Inceptisols (Cambisoluri), and Entisols (Protisoluri). • Multiple Regression • Model selected by Backwards Selection • = June 2009 (10 cm soil temperature - C˚) • b1 = Elevation (m) • b2 = Distance to Mureş (m) BACKGROUND REFERENCES CONCLUSIONS SOIL TEMPERATURE ESTIMATION Soil temperature is known to vary based on elevation, latitude, and aspect. A model for June was created in SAS 9.2 using the backwards selection technique. The influential variables were elevation and distance to the Mureş River. Using a synthesis of SAS and GIS, an estimated soil temperature map was created. This allowed for more precision in the estimated map compared to a simple spline interpolation map of the same data. Our question became “What is Mureş showing?” The initial model for June was not significant for other months. As such, a factor analysis was performed in SAS 9.2. The scree plots are shown for both months and sites. Digital elevation model of the Transylvanian Plain, Romania. Estimated 10 cm soil temperature in the Transylvanian Plain, Romania. • Soil temperature can be evaluated at the 10 cm depth using: • SAS • With a multiple regression • p-value = 0.0024 • ArcGIS • Using the model builder • The euclidean distance map to the Mureş River accounts for the watersheds in the plain. It appears that the division seen in the estimated temperatures above is a ridge that is the divider between the Someş River watershed to the North and the Mureş River watershed to the South. • Different models for elevation and distance to the Mureş River are needed for various months. Factor analysis showed two factors of importance, the scores of which will be used for future research: • Run multiple regression with monthly temperature values replaced by factor scores to reduce multicollinearity • Create the modeled maps for all months to produce planting and fertilization dates for the agricultural producers of the Transylvanian Plain. The TP is a geographical region located in north-central Romania and is bordered by large rivers to the north and south, the Someş and the Mureş, respectively. The TP is ~395,000 ha and ranges from 200-600 m in elevation, with some of the highest elevations occurring in the NW region. Contrary to the name, the TP consists of rolling hills with patches of forests located on the tops of hills. The region is an agricultural zone with major crops of corn, sugar beet, wheat, sunflower, and forages. The goals of this project were to: 1) create a model for 10 cm soil temperature for the creation of suggested planting date maps, 2) perform a factor analysis across sites and months to look at similarities and differences. • ArcGIS Model • Raster maps were created to account for the parameter estimates from the regression model • The parameter estimates were then multiplied by the Euclidean distance map and the DEM SAS Institute Inc. 2008. SAS/STAT® 9.2. Cary, NC: SAS Institute Inc. ESRI, Inc. 2009. ArcGIS Desktop 9.3.1. Redlands, CA. Stations located in the Transylvanian Plain, Romania. • Factor Analysis • Analyzed across sites and across months • 20 Sites • 15 Months (March 2009 – May 2010) ANOVA Table from SAS. Spline interpolation of factor 2 (Soil moisture decrease in winter months influence) in Transylvanian Plain, Romania using ArcGIS 9.3. Spline interpolation of factor 1 (Vegetation influence) in Transylvanian Plain, Romania using ArcGIS 9.3.


