Download
1 / 22
220 likes | 357 Vues
Long-Term Outcomes after Acute Stroke Treatment. Larry B. Goldstein, M.D. Professor of Medicine (Neurology) Center for Cerebrovascular Disease Center for Clinical Health Policy Research Duke University and Durham VA Medical Center. Disclosures None relevant. Quality of life.

E N D
Long-Term Outcomes after Acute Stroke Treatment Larry B. Goldstein, M.D. Professor of Medicine (Neurology) Center for Cerebrovascular Disease Center for Clinical Health Policy Research Duke University and Durham VA Medical Center Disclosures None relevant
Quality of life Quality of life Participation Dimension Handicap Activities Dimension Disability Body Dimension Impair- ment Levels of Outcome MeasurementWorld Health Organization
Level of Measurement Disease Body Dimension Activities Dimension Participation Dimension Severity Comorbidity Severity Comorbidity Severity Comorbidity Motivation Depression Social Sup. Motivation Depression Social Sup. Education Occupation Access
Which Scales? • Reliable • Valid • Sensitive to change • Logistically feasible
Reliability (Precision) • Degree of agreement between or among observers • Inter-observer agreement • Degree of agreement between observations • Intra-observer agreement (test-retest)
Validity (Accuracy) • Content validity • Does the scale includes all relevant dimensions of what is being measured? • Criterion validity • Concurrent validity - Does the scale produce the same result as a “gold standard?” • Predictive validity - Does scale predict future health status? • Construct validity • Discriminant validity - Do the results differ from measures of a different type of deficit? • Convergent validity - Is the scale responsive to change?
Quality of life Participation Dimension Activities Dimension Body Dimension Stroke ScalesLevels of Outcome Measurement NIH Stroke Scale Canadian Stroke Scale European Stroke Scale Scandinavian Stroke Scale
Quality of life Participation Dimension Activities Dimension Barthel Index Katz Kenny Functional Independence Measure IADL Body Dimension NIH Stroke Scale Canadian Stroke Scale European Stroke Scale Scandinavian Stroke Scale Stroke ScalesLevels of Outcome Measurement
Instrumental ADLApplication to Stroke • No consensus for a clear definition of IADL • Measure ability to live independently in the home • Bridge delineation between disability and handicap • Core activities • Domestic chores • Household management • Outdoor activities • Transportation Chong Stroke 1995; 26: 1119
IADL Scales for StrokeEvidence for Reliability and Validity Chong Stroke 1995; 26: 1119
Quality of life Participation Dimension Activities Dimension Body Dimension NIH Stroke Scale Canadian Stroke Scale European Stroke Scale Scandinavian Stroke Scale Stroke ScalesLevels of Outcome Measurement Rankin Index Glasgow Outcomes Scale Barthel Index Katz Kenny Functional Independence Measure IADL
Quality of life Participation Dimension Activities Dimension Body Dimension NIH Stroke Scale Canadian Stroke Scale European Stroke Scale Scandinavian Stroke Scale Stroke ScalesLevels of Outcome Measurement SF-36 Sickness Impact Profile Stroke Impact Scale Rankin Index Glasgow Outcomes Scale Barthel Index Katz Kenny Functional Independence Measure IADL
Quality Adjusted Life YearsQALYS • Outcome of clinical trial • Assign QOL weights • Calculate QALY • Assumes QOL rating independent of time in that state • Implies 2 QALYs is twice as good as 1 QALY • 1 person gaining 10 QALYs = 10 persons gaining 1 QALY • Estimate of costs for that state used for cost-effectiveness analysis
Quality of life Participation Dimension Activities Dimension Body Dimension NIH Stroke Scale Canadian Stroke Scale European Stroke Scale Scandinavian Stroke Scale Stroke ScalesLevels of Outcome Measurement SF-36 Sickness Impact Profile Stroke Impact Scale Rankin Index Glasgow Outcomes Scale Barthel Index Katz Kenny Functional Independence Measure IADL
Effect of Comorbid Conditions Goldstein et al Stroke 2004; 35: 1941
Competing EventsCumulative Recurrence Rates 30% of Strokes are recurrent events Petty et al. Neurology 1998; 50: 208
Causes of Death After Stroke Hankey et al. Stroke 2000; 31: 2080
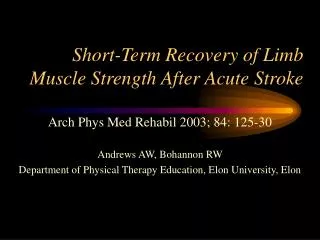
Motor Recovery After StrokeDurham County Stroke Study Duncan et al. Stroke 1992; 23: 1084
Long-Term Outcomes after Stroke Disease Body Dimension Activities Dimension Participation Dimension Severity Comorbidity Severity Comorbidity Severity Comorbidity Motivation Depression Social Sup. Motivation Depression Social Sup. Education Occupation Access TIME