Download
1 / 18
180 likes | 347 Vues
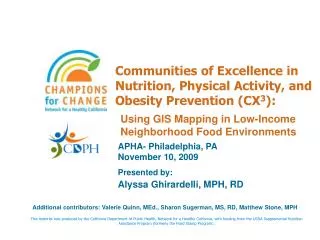
CX 3. Use of GIS to Map Low-Income Food Environments APHA November 6, 2006. Alyssa Ghirardelli, MPH, RD Research Associate Cancer Prevention and Nutrition Section California Department of Health Services. Communities of Excellence in Nutrition, Physical Activity, and Obesity Prevention.

E N D
CX3 Use of GIS to Map Low-Income Food Environments APHA November 6, 2006 Alyssa Ghirardelli, MPH, RD Research Associate Cancer Prevention and Nutrition Section California Department of Health Services Communities of Excellence in Nutrition, Physical Activity, and Obesity Prevention Co-Authors: Valerie Quinn, M.Ed., Ellen Feighery, R.N., M.S., Mathew Stone, M.P.H., Sharon Sugerman, M.S., R.D., F.A.D.A.
CX3 Defined • Documents the physical environment and empowers local action to change the environment to support individual behaviors • A planning model that involves assessing communities in relation to a variety of obesity prevention benchmarks known as community indicators and assets. • Based on CX- Communities of Excellence model developed by California Tobacco Control Section • 3= nutrition, physical activity and obesity prevention
CX3 Goals • Empower communities • Assess a community’s strengths, assets, gaps & weaknesses • Set priorities based on data • Develop strategic local data-driven action plans • Broaden participation at local level • Evaluate progress • Policy Action at the Local Level
Indicators organized in 6 Community Environments: Neighborhood Preschool School After-school Worksite Government Assets organized into: Health department infrastructure Political will Community infrastructure CX3Standardized Indicators & Assets
GIS Mapping Phase:Mapped CX3 Indicators Neighborhood Environment • Access to Supermarkets • Markets with >20 employees • Transit to supermarkets • Farmers Markets • Density of Fast Food • Fast food chain/not chain • Pizza • Deli
CX3 Pilot Project:Sites • Six Sites • Sites are all Health Departments • Dense urban, suburban, rural, and remote areas
CX3 Pilot Project:Neighborhood Selection • Chose 3-7 low-income neighborhoods • Each neighborhood comprised of 1-5 census tracts • >50% of population in census tract at or below 185% Federal Poverty Level (FPL) • Other selection factors • Established partnerships • Race/Ethnic make-up • Rural and Urban (for some sites) • Obesity rates (used by one site)
GIS Mapping Phase: On-line System California Nutrition Network Map Viewer– Developed in 2003
GIS Mapping Process: Usability • All sites either attended the GIS training or had used GIS previously • Also received detailed instructions as part of CX3 • A few were highly skilled at GIS • Usability of the GIS system ranged from “difficult” to “very easy” • What users liked about the GIS • Number and types of layers available • Buffers • Ability to zoom and pan • Seeing which markets accept WIC & EBT • Ability to visually see where things are located
GIS Mapping Process:Challenges • Initially used for statewide perspective, now adapting for use at neighborhood level • Retail store data layer from industry source, only as accurate as provided from source • Categories for stores not always accurate • Difficulties with using the number of employees as way to designate supermarkets • Sometimes data missing categories/locations for fast foods
GIS Mapping Process:Interesting Findings • 19 low-income neighborhoods (not representative sample for California) • No food deserts identified • Decent access to supermarkets with 9 neighborhoods having ½ mile or less as average distance to supermarkets • Most residents travel on average < 1 mile to supermarket (only 1 neighborhood with average distance of 4 miles)
GIS Mapping Process:Interesting Findings • Two Bay Area pilot sites have good access to farmer’s markets • Other 4 counties have mixed access to farmer’s markets, with 1 county having no access in any of the CX3neighborhoods • Several neighborhoods saturated with fast food outlets • 5 neighborhoods have between 12-22 outlets, with several outlets within 1000 ft. of schools
GIS Mapping Process:Questions/Issues Raised... • Wonderful tool with power, however.... • Does our GIS system provide data necessary to answer neighborhood level questions? • Need to examine quality of retail data source (markets and fast food outlets) and how to improve in quickly changing landscape of data • How to compare low-income neighborhoods with average/median neighborhood
GIS Mapping Process:Conclusions • If using data for local action with policy makers and community partners, accurate data needed at neighborhood level • GIS is great first step to neighborhood assessment, but it is essential to get into the community to really capture food environment
For more information or to make connection: Alyssa Ghirardelli, MPH, RD Research Associate, California Department of Health Services, Cancer Prevention and Nutrition Section aghirard@dhs.ca.gov 916-449-5342