Download
1 / 29
310 likes | 571 Vues
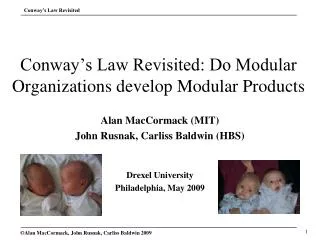
Conway’s Law Revisited: Do Modular Organizations develop Modular Products. Alan MacCormack (MIT) John Rusnak, Carliss Baldwin (HBS) Drexel University Philadelphia, May 2009. Broad Research Context. Increasing importance of Architecture/Modularity in literature

E N D
Conway’s Law Revisited: Do Modular Organizations develop Modular Products Alan MacCormack (MIT) John Rusnak, Carliss Baldwin (HBS) Drexel University Philadelphia, May 2009
Broad Research Context • Increasing importance of Architecture/Modularity in literature • Industry level: Baldwin and Clark, 2000 • Firm level: Henderson and Clark, 1992; Schilling, 2000 • Product Line level: Sanderson and Uzumeri, 1995 • Project level: Thomke and Reinertson, 1998; MacCormack, 2001 • Little empirical work that develops robust, repeatable measures of Architecture/Modularity and highlights predictive power • Categorical and theoretical work: Ulrich 1995; Schilling 2000 • Empirical studies use very different measures; very different levels of analysis, e.g., outsourcing-Schilling, 2000; patents-Fleming, 2004 Our Research Tackles this Gap
The Mirroring Hypothesis Choice of Product Architecture Conway’s Law Functional Requirements Organizational Structure Source: Adapted from Ulrich, 1995 Do the Designs that Emerge from Distributed Organizations differ Systematically from the Designs that Emerge from Firms?
The Opportunity: Software • Software = information based product: design consists of instructions (source code) which tells computer what to do • Designs can be processed automatically to capture dependencies • Can track the “living history” of a design over time • Software tools track versions – open source versions freely available • Software architecture work has long history, yet few metrics • Parnas, 1972: proposed the concept of information hiding for dividing code into modular units – separate internal design from interfaces • Natural Experiment: Different modes of organization; Open Source (large, distributed teams) vs Closed (small, collocated) • H1: Open source products are more modular than proprietary products
Measuring Modularity:Design Structure Matrices • Highlights the structure of a design by examining dependencies between its component tasks/elements in matrix form; (Steward; Eppinger et al; Pimmler and Eppinger; Sosa et al,..) • Prior work identifies dependencies between Design Tasks; We map dependencies across Design Elements for existing designs
Choice 1: Unit of Analysis Source File = Collection of related Functions Work is allocated at this level; development and version control tools work at this level History in Software Literature Choice 2: Dependencies “Function Calls” (Request to perform a specific task) One important type of dependency (can extend methods to other types) Use commercial “Extractor” Choice of Dependency:“Function Calls” between “Source Files”
“Architectural View” of Linux Version 0.01 Definitions:- A calls B- A “uses” B- A “depends on” BUltimately, A “needs to know” about B
A B C D Measuring Modularity: “Propagation Cost” A B C D A 0 1 0 0 M = B 0 0 1 0 C 0 0 0 1 D 0 0 0 0 A B C D A 0 0 1 0 M2 = B 0 0 0 1 C 0 0 0 0 D 0 0 0 0 A B C D A 0 0 0 1 M3 = B 0 0 0 0 C 0 0 0 0 D 0 0 0 0 A B C D A 0 0 0 0 M4 = B 0 0 0 0 C 0 0 0 0 D 0 0 0 0 Visibility Matrix = all Direct/Indirect Connections Propagation Cost = Density of this Matrix = 62.5% “On average, a change to a single system element potentially affects 62.5% of all system elements.” A B C D A 111 1 V = B 0 111 C 0 0 11 D 0 0 0 1
Systems Differ Dramatically Postgresql (database) Linux (operating system) Propagation cost = 32% Propagation cost = 9.7%
Architects do make a Difference Both DSMs have same size and dependency density… Propagation cost = 5.8% Propagation cost = near 100%
Research Approach: Matched Pair Products • Compare Products of Similar Size and Function • Open Source Software: globally distributed teams of volunteer developers (e.g., Raymond; von Hippel and von Krogh) • Closed Source Software: co-located teams in firms; sharing of information about different parts of the design easier, encouraged • Problem1: Many Open source projects are tiny, no community • Choose only those widely used and have a minimum size (~300 SFs) • Problem2: Difficult to access Closed (proprietary) code • 1: “Ideal” Pair – Open and Closed equivalents can be found • 2: “Proxy” for Closed Source Product – First release of Opened Version • 3: “Implied” – Open project has limited source commit; small team
Sample of Product Pairs* * Statistical Tests first conducted Within Pairs using a Mann-Whitney U Test of Differences in Component Visibility; then Across Pairs: Chances of finding that the open product is more modular than the closed product is (.5)^5 = 0.03125: P<.05
Pairs: Financial Mgmt (“Ideal”) Financial Management Software
Pairs: Word Processing (“Proxy”) Word Processing Software
Pairs: Spreadsheet (“Proxy”) Spreadsheet Software
Pairs: Operating System (“Ideal”) Linux versus Open Solaris (NB different product scope)
Pairs: Operating System (“Ideal”) Linux versus Apple Darwin XNU (XNU origins; Mach kernel at CMU)
Pairs: Database (“Implied”) MySQL versus Berkeley DB (BDB)
Summary: Hypothesis Holds in all Cases Even so, there is still a puzzle: WHY IS GNUMERIC SO DIFFERENT?
Gnumeric = Open; but not Distributed Method: Count appearances in the feature/change log (NB not all projects have it) One person does ~40% of the work Four people do ~90% of the work
Comparison with Apache Conclusion: Gnumeric much more concentrated
In fact, Contributors Decline over Time Number of Unique Names in Feature Log by Year
Key Conclusions • Substantial differences in levels of Modularity between Software Systems of similar Size and Function • Systems vary by a factor of 8; implications for performance • Consistent with a view that Product Designs “Mirror” the Structure of the Organizations that develop them (Conway) • Result holds across ALL pairs; Gnumeric is not distributed • Rival Hypothesis for why these Dynamics Occur • Designs evolve to reflect their environments; • Closed teams naturally share information and leverage access to parts of the design in other modules; Even if not explicit, design becomes tightly-coupled • Purposeful choices made by system architects; • Open teams require modularity to succeed; smaller pieces eases understanding and reduces cost of contributing; Closed teams focus only on maximizing performance
Some Limitations • Small Sample of Pairs (reflects limited access to code) • Software Industry a Unique Context (Design = Information) • Dominant design (Utterback, 1994) not as constraining? • Pairs were not Developed Contemporaneously • In general, open source products developed after closed products • Might be “learning” that happens; allows for more modularity • Only look at Large open source projects; what about small? • Evidence from SourceForge - no pattern in small projects • Suggests modularity is a necessary condition for success…
Case Study: Changing the Organization E.g., The Redesign of Mozilla (Source: MgmtSci July 2006) BEFORE AFTER Propagation Cost = 17.3% Propagation Cost = 2.8%
Architecture must be Managed! Propagation Cost
Implications for Managers • Understand Organizational Biases in Design Choices • Search space is constrained by organizational characteristics • Challenge: Seldom are these influences Explicit • When you Design Organizations, you also Design Products • Managers must consider potential path dependencies • Consider short-run “sub-optimal” modes (e.g., restrict interaction?) • Implications for a move to “Open Innovation” • These arrangements have a distinct impact on the design • Performance will differ – for better or worse
Explains some of Life’s Conundrums Source: Forbes Magazine, August 10th 1998