Download
1 / 1
10 likes | 149 Vues
MODELING DEFORESTATION AT THE LANDSCAPE LEVEL FROM ANALYSIS AT THE PROPERTY-FARM LEVEL: FINDINGS AND FORECAST FROM THE ALTAMIRA CASE Bruce Boucek, Stephen McCracken, and Eduardo Brondizio Indiana University / ACT, USA.

E N D
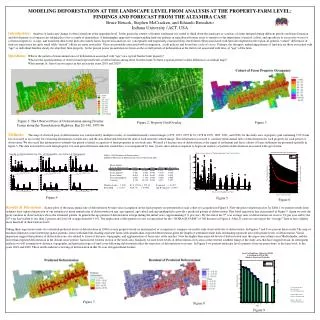
MODELING DEFORESTATION AT THE LANDSCAPE LEVEL FROM ANALYSIS AT THE PROPERTY-FARM LEVEL: FINDINGS AND FORECAST FROM THE ALTAMIRA CASE Bruce Boucek, Stephen McCracken, and Eduardo Brondizio Indiana University / ACT, USA Introduction:Analysis of landscape change is often carried out at the aggregate level. In the particular context of frontier settlement it is useful to think about the landscape as a mosaic of farms initiated during different periods and farm formation and development as a long process taking place over a couple of generations. A demographic approach to understanding land-use patterns in agricultural frontier areas is sensitive to the importance of period, cohort, and age effects as successive waves of colonists migrate to, occupy, and transform their forest plots into family farms. In previous analyses we conceptually and empirically examined these interrelated effects associated with farm development in the region. In general, “cohort” differences in land-use trajectories are quite small while “period” effects are more noticeable. These are primarily associated with in-migration, credit policies and boom-bust cycle of cocoa. Perhaps, the strongest, underlying patterns of land-use are those associated with “age” as individual families slowly develop their farm property. In the present poster presentation we focus on the overall pattern of deforestation at the farm level associated with time, or “age” of the farm. Questions:What is the pattern of mean annual rates of deforestation associated with “age” on a typical frontier farm property? What are the spatial patterns of observed and expected levels of deforestation among these frontier farms? Is there a spatial pattern to their differences (a residual map)? What amount of forest can we expect in this area in the years 2010 and 2020? Figure 1: The Observed Pace of Deforestation among Frontier Farms along the TransAmazon Highway, Km 20-140, 1970-96 Figure 2: Property Grid Overlay Figure 3 Methods:The map of observed pace of deforestation was constructed by multiple overlay of classified remotely sensed images (1970, 1973, 1975 & 76, 1978 & 1979, 1985, 1991, and 1996) for the study area. A property grid containing 3,913 farm lots was used as an overlay for extracting information on farm area, and the area deforested between the date of each remotely sensed image. This information was used to calculate mean annual rates of deforestation for each property for each period of observation. We also used this information to identify the period of initial occupation of farm properties in our study area. We used a 5 hectare area of deforestation as the signal of settlement and these cohorts of farm settlement are presented spatially in figure 3. The data extracted for each farm property, for each period between remotely sensed data, was reorganized by time (years) since initial occupation to begin our analysis of pattern of deforestation associated with age of farm. Figure 4 Figure 5 Figure 6 Results & Discussion:Scatter plots of the mean annual rate of deforestation by time since occupation on the farm property are presented for each cohort of occupation in Figure 4. Note the great variation in rates. In Table 1 we present results from ordinary least-squared regression of our estimates of mean annual rates of deforestation on age, age-squared, age-cubed, and age-quadrupled to provide a predicted pattern of deforestation. This fitted regression line is presented in Figure 5. Again we note the great variation in observed rates above the estimated pattern. In general the age pattern of deforestation is large during the initial years (approximating 6 % per year). By the end of the 5th year average rates of deforestation are close to 3% per year and by the 10th year have fallen to less than 2 percent and level off at approximately 1.6%. The implication of this pattern of rates is represented for the “AVERAGE FARM” of 100 hectares in Figure 6. After 25 years we can expect the “average” farm to have slightly more than half of their farm in forest. Taking these regression results we calculated predicted levels of deforestation in 1996 for each property based on initial period of occupation to compare our results with observed levels of deforestation. In Figures 7 and 8 we present these results The map of residuals illustrates some interesting spatial patterns. Areas with dark blue shading represent farms with smaller-than-expected deforestation given the length of settlement while dark red shading represent area with greater levels of deforestation. Visual inspection suggest that patterns of deforestation are also related to issues of distance, topography, and agglomeration of farms into cattle ranches. Note the higher-than-expected levels of deforestation near the sugar cane refinery near Medicilandia, and the lower than expected deforestation in the distant, more remote, farms in the western section of the study area. Similarly we note lower levels of deforestation a few areas at the extreme southern fringe of the study area that have rugged terrain. In subsequent analysis we will examine how distance, topography, and particular types of land-cover following deforestation affect the trajectory of deforestation over time. In Figure 9 we present landscape level estimates from our projections, at the farm level, to the years 2010 and 2020. These results indicate a slowing of deforestation in this 30-year old agricultural frontier. Contact Information: Bruce Boucek bboucek@indiana.edu Stephen McCracken stmccrac@indiana.edu Eduardo Brondizio ebrondiz@indiana.edu Figure 7 Figure 8 Figure 9