Download
1 / 66
810 likes | 2.55k Vues
Chapter 3 Free Cash Flow Valuation. Intro to Free Cash Flows. If applied to dividends, the DCF model is the dividend discount model (DDM) from Chapter 2.

E N D
Intro to Free Cash Flows • If applied to dividends, the DCF model is the dividend discount model (DDM) from Chapter 2. • Chapter 3 extends DCF analysis to value a firm and the firm’s equity securities by valuing its free cash flow to the firm (FCFF) and free cash flow to equity (FCFE).
Intro to Free Cash Flows • Dividends are the cash flows actually paid to stockholders • Free cash flows are the cash flows available for distribution. • Applied to dividends, the DCF model is the discounted dividend approach or dividend discount model (DDM). This chapter extends DCF analysis to value a firm and the firm’s equity securities by valuing its free cash flow to the firm (FCFF) and free cash flow to equity (FCFE).
Intro to Free Cash Flows • Analysts like to use free cash flow valuation models (FCFF or FCFE) whenever one or more of the following conditions are present: • the firm is not dividend paying, • the firm is dividend paying but dividends differ significantly from the firm’s capacity to pay dividends, • free cash flows align with profitability within a reasonable forecast period with which the analyst is comfortable, or • the investor takes a control perspective.
Intro to Free Cash Flows • Common equity can be valued by either • directly using FCFE or • indirectly by first computing the value of the firm using a FCFF model and subtracting the value of non-common stock capital (usually debt and preferred stock) to arrive at the value of equity.
Defining Free Cash Flow • Free cash flow to the firm(FCFF) is the cash flow available to the firm’s suppliers of capital after all operating expenses have been paid and necessary investments in working capital and fixed capital have been made. • FCFF is the cash flow from operations minus capital expenditures. To calculate FCFF, differing equations may be used depending on what accounting information is available. The firm’s suppliers of capital include common stockholders, bondholders, and, sometimes, preferred stockholders.
Defining Free Cash Flow • Free cash flow to equity (FCFE) is the cash flow available to the firm’s common equity holders after all operating expenses, interest and principal payments have been paid, and necessary investments in working and fixed capital have been made. • FCFE is the cash flow from operations minus capital expenditures minus payments to (and plus receipts from) debtholders.
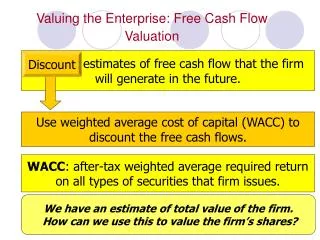
Valuing FCFF • The FCFF valuation approach estimates the value of the firm as the present value of future FCFF discounted at the weighted average cost of capital (WACC) • Discounting FCFF at the WACC gives the total value of all of the firm’s capital. The value of equity is the value of the firm minus the market value of the firm’s debt
Valuing FCFF • Equity Value = Firm Value – Market Value of Debt • Dividing the total value of equity by the number of outstanding shares gives the value per share.
Calculating a WACC • The cost of capital is the required rate of return that investors should demand for a cash flow stream like that generated by the firm. The cost of capital is often considered the opportunity cost of the suppliers of capital.
Calculating a WACC • If the suppliers of capital are creditors and stockholders, the required rates of return for debt and equity are the after-tax required rates of return for the firm under current market conditions. The weights that are used are the proportions of the total market value of the firm that are from each source, debt and equity. • MV(debt) and MV(equity) are the current market values of debt and equity, not their book or accounting values. The weights will sum to 1.0.
Valuing FCFE • The value of equity can also be found by discounting FCFE at the required rate of return on equity (r): • Since FCFE is the cash flow remaining for equity holders after all other claims have been satisfied, discounting FCFE by r (the required rate of return on equity) gives the value of the firm’s equity. • Dividing the total value of equity by the number of outstanding shares gives the value per share.
Single-stage constant-growth FCFF valuation model • FCFF in any period is equal to FCFF in the previous period times (1 + g): • FCFFt = FCFFt–1 (1 + g). • The value of the firm if FCFF is growing at a constant rate is • Subtracting the market value of debt from the firm value gives the value of equity.
Single-stage, constant-growth FCFE valuation model • FCFE in any period will be equal to FCFE in the preceding period times (1 + g): • FCFEt = FCFEt–1 (1 + g). • The value of equity if FCFE is growing at a constant rate is • The discount rate is r, the required return on equity. The growth rate of FCFF and the growth rate of FCFE are frequently not equivalent.
Computing FCFF from Net Income • Free cash flow to the firm (FCFF) is the cash flow available to the firm’s suppliers of capital after all operating expenses (including taxes) have been paid and operating investments have been made. The firm’s suppliers of capital include creditors and bondholders and common stockholders (and occasionally preferred stockholders that we will ignore until later). Free cash flow to the firm is: FCFF = Net income available to common shareholders Plus: Net Non-Cash Charges Plus: Interest Expense times (1 – Tax rate) Less: Investment in Fixed Capital Less: Investment in Working Capital
Computing FCFF from Net Income • This equation can be written more compactly as FCFF = NI + NCC + Int(1 – Tax rate) – Inv(FC) – Inv(WC)
Computing FCFF from CFO • To estimate FCFF by starting with cash flow from operations (CFO), we must recognize the treatment of interest paid. If, as the case with U.S. GAAP, the after-tax interest was taken out of net income and out of CFO, after-tax interest must be added back in order to get FCFF. So free cash flow to the firm, estimated from CFO, is FCFF = Cash Flow from Operations Plus: Interest Expense times (1 – Tax rate) Less: Investment in Fixed Capital
Computing FCFF from CFO • Or you can write the equation as: FCFF = CFO + Int(1 – Tax rate) – Inv(FC)
Non-cash charges • The best place to find historical non-cash charges is to review the firm’s statement of cash flows. • Some common non-cash charges and the adjustments to net income to get cash flow are:
Non-cash charges • Deferred taxes result from a difference in timing of reporting income and expenses on the company’s tax return. The income tax expense deducted in arriving at net income for financial reporting purposes is not the same as the amount of cash taxes paid. Over time these differences between book and taxable income should offset each other and have no impact on aggregate cash flows. In this case, no adjustment would be necessary for deferred taxes.
Non-cash charges • If the analyst’s purpose is forecasting and he seeks to identify the persistent components of FCFF, then it is not appropriate to add back deferred tax changes that are expected to reverse in the near future. In some circumstances, however, a company may be able to persistently defer taxes until a much later date. If a company is growing and has the ability to indefinitely defer tax liability, an analyst adjustment (add-back) is warranted. An acquirer must be aware, however, that these taxes may be payable at some time in the future.
Finding FCFE from FCFF • Free cash flow to equity is cash flow available to equity holders only. It is therefore necessary to reduce FCFF by interest paid to debtholders and to add any net increase in borrowing (subtract any net decrease in borrowing). • FCFE = Free cash flow to the firm Less: Interest Expense times (1 – Tax rate) Plus: Net Borrowing • Or FCFE = FCFF – Int(1 – Tax rate) + Net borrowing
Finding FCFE from NI or CFO • Subtracting after-tax interest and adding back net borrowing from the FCFF equations gives us the FCFE from NI or CFO: FCFE = NI + NCC – Inv(FC) – Inv(WC) + Net borrowing FCFE = CFO – Inv(FC) + Net borrowing
Finding FCFF from EBIT • FCFF and FCFE are most frequently calculated from a starting basis of NI or CFO. Two other starting points are EBIT or EBITDA. • To show the relation between EBIT and FCFF, let us start with the FCFF equation and assume that the non-cash charge (NCC) is depreciation (Dep): FCFF = NI + Dep + Int(1 – Tax rate) – Inv(FC) – Inv(WC)
Finding FCFF from EBIT • Net income (NI) can be expressed as NI = (EBIT – Int)(1 – Tax rate) = EBIT(1 – Tax rate) – Int(1 – Tax rate) • If this equation for NI is substituted for NI in Equation 3-7, we have FCFF = EBIT (1 – Tax rate) + Dep – Inv(FC) – Inv(WC) • To get FCFF from EBIT, multiply EBIT times (1 – Tax rate), add back depreciation, and then subtract the investments in fixed capital and working capital.
Finding FCFF from EBITDA • To show the relation between FCFF from EBITDA (Earnings Before Interest, Taxes, Depreciation and Amortization), use the formula for FCFF: FCFF = NI + Dep + Int(1 – Tax rate) – Inv(FC) – Inv(WC) • Net income can be expressed as NI = (EBITDA – Dep – Int)(1 – Tax rate) NI = EBITDA(1 – Tax rate) – Dep(1 – Tax rate) – Int(1 – Tax rate)
Finding FCFF from EBITDA • Substituting this for NI in the FCFF equation results in FCFF = EBITDA(1 – Tax rate) + Dep(Tax rate) – Inv(FC) – Inv(WC) To get FCFF from EBITDA, multiply EBITDA times (1 – Tax rate), add back depreciation times the tax rate, and then subtract the investments in fixed capital and working capital
Forecasting free cash flows • Computing FCFF and FCFE based upon historical accounting data is straightforward. Often times, this data is then used directly in a single-stage DCF valuation model. • On other occasions, the analyst desires to forecast future FCFF or FCFE directly. In this case, the analyst must forecast the individual components of free cash flow. This section extends our previous presentation on computing FCFF and FCFE to the more complex task of forecasting FCFF and FCFE. We present FCFF and FCFE valuation models in the next section.
Forecasting free cash flows • Given that we have a variety of ways in which to derive free cash flow on a historical basis, it should come as no surprise that there are several methods of forecasting free cash flow. • One approach is to compute historical free cash flow and apply some constant growth rate. This approach would be appropriate if free cash flow for the firm tended to grow at a constant rate and if historical relationships between free cash flow and fundamental factors were expected to be maintained.
Forecasting FCFF • One approach recognizes that capital expenditures have two components; those expenditures necessary to maintain existing capacity (fixed capital replacement) and those incremental expenditures necessary for growth. When forecasting, the former are likely to be related to the current level of sales, while the latter are likely to be related to the forecast of sales growth.
Forecasting FCFF • When forecasting FCFE, analysts often simplify the estimation of FCFF and FCFE. Equation 3-7 can be restated as • FCFF = NI + Int (1 – Tax rate) – (Capital spending – Depreciation) – Inv(WC) which is equivalent to • FCFF = EBIT (1 – Tax rate) – (Capital spending – Depreciation) – Inv(WC) • The components of FCFF in these equations are often forecasted in relation to sales.
Forecasting FCFE • If the firm finances a fixed percentage of its capital spending and investments in working capital with debt, the calculation of FCFE is simplified. Let DR be the debt ratio, debt as a percentage of assets. In this case, FCFE can be written as • FCFE = NI – (1 – DR)(Capital Spending – Depreciation) – (1 – DR)Inv(WC) • When building FCFE valuation models, the logic, that debt financing is used to finance a constant fraction of investments, is very useful. This equation is pretty common.
What about dividends and stock repurchases? To find FCFF or FCFE, ignore dividends and stock repurchases. Recall two formulas for FCFF and FCFE, FCFF = NI + NCC + Int(1 – Tax rate) – Inv(FC) – Inv(WC) FCFE = NI + NCC – Inv(FC) – Inv(WC) + Net borrowing Notice that dividends and other stock transactions are absent from the formulas. The reason is that FCFF and FCFE are the cash flows available to investors or to stockholders, while dividends and share repurchases are uses of these cash flows. Transactions between the firm and its shareholders (through cash dividends, share repurchases and share issuances) do not affect free cash flow.
What about dividends and stock repurchases? Leverage changes, such as using more debt financing, would have some impact because they would increase the interest tax shelter (reducing corporate taxes because of the tax deductibility of interest) and reduce the cash flow available to equity. In the longer run, however, investing and financing decisions made today will affect future cash flows.
Preferred stock in the capital structure • Including preferred stock as a third source of capital can cause the analyst to add terms to the equations for FCFF and FCFE for the dividends paid on preferred stock and for the issuance or repurchase of preferred shares. • Instead of including those terms in all of the equations, we chose to leave preferred stock out since it exists only for a minority of corporations. For those companies that do have preferred stock, the effects of preferred stock can be incorporated with good judgment. For example, when we are calculating FCFF starting with Net income available to common, Preferred dividends paid would have to be added to the cash flows to obtain FCFF.
Preferred stock in the capital structure • When we are calculating FCFE starting with Net income available to common, if Preferred dividends were already subtracted when arriving at Net income available to common, no further adjustment for Preferred dividends is required. However, issuing (redeeming) preferred stock increases (decreases) the cash flow available to common stockholders, so this term would be added in. • In many respects, the existence of preferred stock in the capital structure has many of the same effects as the existence of debt, except that preferred stock dividends paid are not tax deductible unlike interest payments on debt.
Two-stage FCF models • FCF models are much more complex than DDMs because the analyst usually estimates sales, profitability, investments, financing costs, and new financing to find FCFF or FCFE. • In two-stage FCF models, the growth rate in the second stage is a long-run sustainable growth rate. For a declining industry, the second stage growth rate could be slightly below the GDP growth rate. For an industry that will grow in the future (relative to the overall economy), the second stage growth rate could still be slightly greater than the GDP growth rate.
Two-stage FCF models • The two most popular versions of the two-stage FCFF and FCFE models are: • the growth rate is constant (or given) in stage one, and then it drops to the long-run sustainable rate in stage two. • the growth rates are declining in stage one, reaching the sustainable rate at the beginning of stage two. This latter model is like the H model for dividend valuation.
Two-stage FCF models • The growth rates can be applied to different variables. The growth rate could be the growth rate for FCFF or FCFE, or the growth rate for income (such as net income), or the growth rate could be the growth rate for sales. If the growth rate were for net income, the changes in FCFF or FCFE would also depend on investments in operating assets and financing of these investments. When the growth rate in income declines, such as between stage one and stage two, investments in operating assets will probably decline at the same time. If the growth rate is for sales, changes in net profit margins as well as investments in operating assets and financing policies will determine FCFF and FCFE.
Two-stage FCF models • A general expression for the two-stage FCFF valuation model is • The summation gives the present value of the first n years’ FCFF. The terminal value of the FCFF from year n+1 onward is FCFFn+1 / (WACC – g), which is discounted at the WACC for n periods. Subtracting the value of outstanding debt gives the value of equity. The value per share is then found by dividing the total value of equity by the number of outstanding shares.
Two-stage FCF models • The general expression for the two-stage FCFE valuation model is • The summation is the present value of the first n years’ FCFE, and the terminal value of FCFEn+1 / (r – g) is discounted at the required rate of return on equity for n years. The value per share is found by dividing the total value of equity by the number of outstanding shares.
Nonoperating assets and firm value • Analysts usually segregate operating and non-operating assets when they value a firm. • Many non-operating assets are financial assets that can be directly valued by observing their market prices. It is unnecessary to use a valuation model when the market value can be observed reliably. • Non-operating assets that are not contributing operating income to the firm could be sold. The liquidation value of these non-performing assets could then be added to the value of the performing assets.
Nonoperating assets and firm value • Finally, if non-operating assets are not segregated, the cash flows from these assets could be combined with the cash flows of the operating assets, often making it difficult to find the cash flows of the operating assets. For example, interest and dividend income and capital gains from an investment portfolio could mask the fact that the company’s operating profitability is poor. The value of the firm should be the value of its operating and non-operating assets: Value of firm = Value of operating assets + Value of non-operating assets.
Nonoperating assets and firm value • When calculating FCFF or FCFE, investments in working capital do not include any investments in cash and marketable securities. The value of cash and marketable securities should be added to the value of the firm’s operating assets to find the total firm value. • Some companies have substantial non-current investments in stocks and bonds that are not operating subsidiaries but financial investments. These should be reflected at their current market value. Based on accounting conventions, those securities reported at book values should be revalued to market values.
Nonoperating assets and firm value • Finally, many corporations have overfunded or underfunded pension plans. The excess pension fund assets should be added to the value of the firm’s operating assets. Likewise, an underfunded pension plan should result in an appropriate subtraction from the value of operating assets.
Nonoperating assets example • Virginia Mak is estimating the value of Charleson Partners, a non-publicly traded Canadian food wholesaler. Mak has assembled the following information for her appraisal. • The firm’s operating assets generated a FCFF of CD35 million in the year just ended. A perpetual growth rate of 5% is expected for FCFF. • The weighted average cost of capital is 11%. • Charleson Partners has non-operating assets of • CD12 million of cash and short-term marketable securities • CD105 million in a diversified portfolio of common stocks and bonds • Pension fund assets of CD75 million and pension fund liabilities of CD58 million. • Charleson has total debts (notes and bonds payable) with an estimated market value of CD 108 million. • There are 8,250,000 outstanding shares.
Nonoperating assets example The value of the operating assets (in million CD) is The value of the non-operating assets is: Cash and short-term investments CD 12 million Stock and bond portfolio CD 105 million Pension fund surplus (75 – 58) CD 17 million Total non-operating assets: CD 134 million The total value of the firm is Value of operating assets + Value of non-operating assets = 385 + 134 = CD 519 million. The value of equity is the total value of the firm less the market value of its debt obligations, or 519 – 108 = CD 411 million. Finally, the value per share is CD 411 million / 8,250,000 shares = CD 49.82.
Cash & Equivalents / Market value Cash and Equivalents December 2001
Proust Company (#5) Proust Company has free cash flow to the firm of $1.7 billion and free cash flow to equity of $1.3 billion. Proust’s weighted average cost of capital is 11 percent and its required rate of return for equity is 13 percent. FCFF is expected to grow forever at 7 percent and FCFE is expected to grow forever at 7.5 percent. Proust has debt outstanding of $15 billion. A. What is the total value of Proust’s equity using the FCFF valuation approach? B. What is the total value of Proust’s equity using the FCFE valuation approach?
Proust Company solution A. The Firm Value is the present value of FCFF discounted at the weighted average cost of capital (WACC), or The market value of equity is the value of the firm minus the value of debt: Equity = 45.475 – 15 = $30.475 billion. B. Using the FCFE valuation approach, the present value of FCFE, discounted at the required rate of return on equity, is The value of equity using this approach is $25.409 billion.