Cross-sectional and case-control studies
Cross-sectional and case-control studies. Jane Garbutt MBChB, FRCP(C) Jgarbutt@im.wustl.edu. Study Question. Study Design. Results. Answer. ERROR Random or Systematic. TRUTH. Charlie Brown.

Cross-sectional and case-control studies
E N D
Presentation Transcript
Cross-sectional and case-control studies Jane Garbutt MBChB, FRCP(C) Jgarbutt@im.wustl.edu
Study Question Study Design Results Answer ERROR Random or Systematic TRUTH
Charlie Brown • A previously healthy, 3 year old. boy presents to your office in St Louis with acute otitis media. • No known drug allergies • No child care • One previous episode of AOM last winter • Immunizations are up to date for age • What treatment????
Acute Otitis Media (AOM) • By age 3 yrs, 80% of children have had >1 episode, ~50% have >3 • Responsible for 30% of outpatient antibiotic prescriptions for children • Antibiotic treatment for Streptococcus pneumoniae. • Causative in 40-60% cases • Spontaneous resolution in 20%
Recommended treatment for AOM • Amoxicillin • 40mg/kg/d if uncomplicated • 80mg/kg/d if high risk NSSP • High dose may not be necessary if local prevalence NSSP is low
What is the probability that Charlie’s AOM is due to penicillin-resistant S. pneumoniae? • < 10% • 10 - 25 % • 26 - 50% • > 50%
What is the local prevalence of NSSP in children with AOM? Lab specimensNSSP National 27% State 11% - 17% SLCH 53% Surveillance studies MEE 43% - 80% NP specimens 20% - 90%
Methods Design • Cross-sectional study at 7 local pediatric practices • March-May 2000 and Feb-April 2001 • Pilot at SLCH EU Patients • Eligible: • New infection - URI, AOM, OME, sinusitis, streptococcal pharyngitis, cough • <6 years old • Exclusions: • Antibiotic in the past month, chronic illnesses • Self or sibling previously enrolled
Results Patient Characteristics (N=212) N% Age < 2 years 115 54% Female gender 94 44% Caucasian 103 48% Medicaid 86 41% Attends child care 83 39% Asthma 49 23% *Prevnar (> 1 dose) 44/94 47% * Used only in 2001
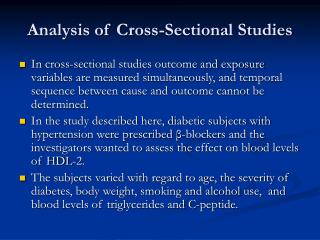
Cross-sectional studies • Snap shot • Measure exposure and outcome variables at one point in time. • Main outcome measure is prevalence P = Number of people with disease x at time t Number of people at risk for disease x at time t Prevalence=k x Incidence x Duration
Useful baseline assessment Generalizable results if population based sample Study multiple outcomes and exposures Immediate outcome assessment and no loss to follow-up, therefore faster, cheaper, easier Can measure prevalence Hypothesis generating for causal links Serial surveys eg, Census Cross-sectional studies - Strengths
Cross-sectional studies Weaknesses • Provide limited information • Cannot establish sequence of events • Not for causation or prognosis (inc, RR, AR) • Look for biological plausibility in causal links • Impractical for rare diseases if pop based sample (eg, gastric ca 1/10,000). Could use in rare disease registry (Kaposis sarcoma in AIDS). • Prone to bias (selection, measurement)
Bias in cross-sectional studies Selection Bias (eg, NSSP study) Is study population representative of target population? Is there systematic increase or decrease of RF? Measurement Bias Outcome • Misclassified (dead, misdiagnosed, undiagnosed) • Length-biased sampling • Cases overrepresented if illness has long duration and are underrepresented if short duration.(Prev = k x I x duration) Risk Factor • Recall bias • Prevalence-incidence bias • RF affects disease duration not incidence eg, HLA-A2
Cross-sectional studies - Uses • Prevalence used in planning • Individual Pre-treament probability for Rx and Dx • Population Health care services • Describe distribution of variables (Census, NHANES, Table 1) • Examine associations among variables • Hypothesis generating for causal links • Prediction rule eg, Ottawa ankle rule – XR if 3 factors present
Case-Control Studies Study Onset Time Exposed Cases Unexposed Exposed Controls Unexposed Direction of Inquiry
Case-control studies FROM SOURCE POPULATION: • Select cases with outcome (representative of cases in source population) • Select controls without outcome (same exposure distribution to RF as source population) • Hospital, clinic, neighborhood, population • Can be > 1 control per case (Increases power and face validity, and decreases selection bias) • Outcome can be disease, disability or positive outcome • Measure strength of association of RF and outcome with OR (~RR)
Case-control studies - Uses Study questions • How does exposure to x affect risk of outcome y? • Does IUD use increase the risk of spontaneous abortion? • What is the association between g-o reflux and oesophageal cancer?
Is g-o reflux a RF for oesoph ca? • How were cases selected? • Were cases representative of patients with disease? • How were controls selected? • Were controls representative of patients from source population without disease? • How were risk factors measured? • How did they minimize measurement bias for RF? • How were outcomes measured? • How did they minimize measurement bias for outcomes?
Case-Control Studies Decrease selection bias by: • Population based sample • Cases - registry • Controls - from same population (random digit dialing) • Sample cases and controls in same way (same clinic) so RF exposure is the same • Minimize non-participants • >1 control groups (increases power and generalizability) • Matching • Case and control comparable on RF that is not interesting, or not modifiable e.g. age, gender • Advantages: Increased precision, decreased confounding • Disadvantages: Loss of data, increased time, cost, complexity, irreversible.
Case-Control Studies Bias in measurement of risk factors because: • Retrospective measurement • Differential recall bias Decrease measurement bias for outcomes and RF by: • Standardize definitions, instrument and process • Train assessors • Use data recorded before outcome is known • Blinding of subject and observer • Re-analyze data with more conservative definitions
Subjects Case/control status Both cases and controls have diseases possibly related to RF RF exposure Dummy variables Observers Case/control status If cases not externally recognizable RF exposure Dummy variables Unaware of hypothesis Case-Control Studies - Blinding
What did they find? Esoph Gastric Esoph adenoca adenoca squamous ca Heartburn, 7.5 2.0 0.9 Reflux or (5.4-10.6) (1.5-2.8) (0.6-1.4) Both > 1x/wk
Case-control studies - strength of association Disease Cases Controls Risk Yes a b Factor No c d Odds Ratio (OR)= a/a + b = ad c/c + d bc OR~RR if rare disease or sampling error is small and exposure distribution is the same for both groups
Heartburn and oesoph adenoca Disease Cases Controls Risk Yes 113 135 Factor No 76 685 Odds Ratio (OR)= ad = 77405 = 7.5 bc 10260 (data from Lagergren, NEJM 1999, Table 2)
Case-control studies - Strengths • Quick, cheap, feasible. • Efficient if rare disease or long latency • Can estimate strength of association of RF with outcome by OR(~RR) • Useful to generate causal hypotheses eg, Reyes syndrome and ASA (4 controls)
Case-control studies - Weaknesses • Cannot measure prevalence, inc, RR • Only one outcome • SUSCEPTIBLE TO BIAS • Selection bias • Are cases representative of patients with disease? (misclassification, referral bias, diagnostic bias) • Are controls representative of patients from source population without disease? • Measurement bias - RF and outcome
Do you believe their results? Selection bias? Cases, controls Measurement bias? Outcomes, RF Causation? • Strength of association • Dose response • frequency, severity, duration of symptoms • Biological plausibility
Observational studies • Cohort Exposure to outcome • Case control Outcome to exposure • Cross-sectional Exposure and outcome ALL ARE PRONE TOBIAS • Selection Bias Population based sample, large sample, selection criteria, matching • Measurement Bias Standardization, training, prospective data collection, blinding