Probabilistic Miss Equations: Evaluating Memory Hierarchy Performance
350 likes | 501 Vues
Probabilistic Miss Equations: Evaluating Memory Hierarchy Performance. Emilio L. Zapata Depto. de Arquitectura de Computadores. Basilio B. Fraguela Ramón Doallo Depto. de Electrónica e Sistemas. Universidade da Coruña. Universidad de Málaga. Introduction.

Probabilistic Miss Equations: Evaluating Memory Hierarchy Performance
E N D
Presentation Transcript
Probabilistic Miss Equations: Evaluating MemoryHierarchy Performance Emilio L. Zapata Depto. de Arquitectura de Computadores Basilio B. Fraguela Ramón Doallo Depto. de Electrónica e Sistemas Universidade da Coruña Universidad de Málaga
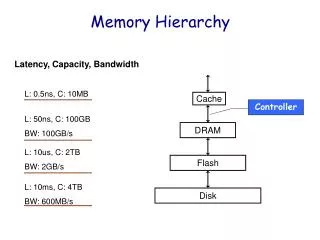
Introduction • Increasing gap between processor and memory speeds: bottleneck for systems performance • Approaches to study cache behavior: • Trace-driven simulations: slow, not flexible. • Built-in hardware counters: not flexible, no portability. • Modeling: quick, flexible, little precision. Many models require a trace to extract some input parameters. • We present a systematic modeling strategy that allows a fast analysis that provides good levels of accuracy. • Supports set associative caches with LRU replacement.
Misses Nature • Kinds of misses • Intrinsic/compulsory: first reference to a line • There will be one per each different line accessed • Interference: a non-first reference to a line misses • Each attempt to reuse a line will result in a miss with a given miss probability • This probability depends on the impact on the cache of the memory regions accessed since the last access to the line. • The portion of code executed between the last access to the line and the new access is called the reuse distance • A line may have several reuse distances • Each reuse distance has a miss probability, estimated from the memory regions accessed during it.
Miss Estimation • The misses generated by a reference in a loop may be estimated by a formula that contains • The number of different lines it accesses • The number of line reuses it gives place to per possible reuse distance • The miss probability for each of the reuse distances • Fourth factor (external): miss probability in the first access to each line by the reference • The formula is different for each nesting level (loop) enclosing the reference
Example DO J=1,5 DO I=1, 100 A(I) = I + J END DO END DO • Assume 10 elements of A per cache line • Inner loop: 10 different lines, 90 (sure) reuses • Outer loop: 1 first-time iteration, 4 reuses
Initial Modeling Scope DO I0=1, N0, L0 DO I1=1, N1, L1 ... DO IZ=1, NZ, LZ A(fA1(IA1), fA2(IA2), ..., fAdA(IAdA)) ... B(fB1(IB1), fB2(IB2), ..., fBdB(IBdB)) ... END DO ... C(fC1(IC1), fC2(IC2), ..., fCdC(ICdC)) ... END DO END DO
Probabilistic Miss Equation • Simplest PME form where Number of different lines accessed by R during the execution of the loop in nesting level i Stride of the reference in the loop Line size
PMEs: Not so fast! • The previous PME is only valid for references that carry no reuse with others • Our model accurately takes into account the potential reuse between references in translation to build the PMEs • Reuse among references that are not in translation is not modeled currently
Reuse Among Different Nests DO Ij-1=1, Nj-1, Sj-1 DO Ij0=1, Nj0, Sj0 ... A(fA01(IA01), ..., fA0dA(IA0dA)) ... END DO ... DO Ij1=1, Nj1, Sj1 ... A(fA11(IA11), ..., fA1dA(IA1dA)) ... END DO ... ... ... ... ... ... ... DO Ijn=1, Njn, Sjn ... A(fAn1(IAn1), ..., fAndA(IAndA)) ... END DO END DO • Same strategy for loops in levels up to j • The number of misses in loops jk, k>0 is a constant • the initial miss probability is estimated in a conservative way considering the whole execution of the preceding loop • In loop j0 this probability is an extern parameter, except for reuse iterations • This only works well if several conditions hold
Miss Probabilities: Basics (I) • Miss probability depends on the impact on the cache of the memory regions accessed since the last access to the line to reuse “In a K-way set with LRU replacement policy, a given line is replaced when K or more different lines mapped to its same cache set have been referenced since its last access”
Miss Probability: Basics (II) • Miss probability = probability K or more lines have been mapped to the sets of the lines to reuse during the reuse distance • Notice that the ratio of cache sets that have X lines is also the probability a given cache set has X lines • We need a way to represent the distribution of the number of lines assigned to each set during the reuse distance
Area Vectors • Associated to data structure V we have area vector • The area vector for each data structure is calculated separately as a functions of its access pattern
Interference Area Vectors Calculation • The references are analyzed in each nesting level i to count the number of points accessed in each dimension d (Nrid) and the distance between each two of them (Lrid) • The region accessed may be described as the tuple • In general this region describes an area with the shape of either a sequential access or an access to groups of consecutive elements separated by a constant stride. • These two accesses (and others) have been modeled for the calculation of their corresponding interference area vectors
Area vectors union • As independent probabilities:
Consideration of the Relative Positions • For each pair of data structures A and B, their overlapping coefficient Sol(A,B) is calculated: portion of cache sets that may contain lines belonging to both structures. • Before adding the interference area vector generated by one of them in order to calculate the miss probability in the accesses to the other one, it is scaled using this factor • If both references are sequential and are in translation (their indices only differ in added constants), a simple algorithm with total precision is applied
Memory Performance Analysis Tool: MEPAT • The model was integrated in Polaris • FORTRAN codes with references with affine indexes can be analyzed • Predicts the behavior of caches with an artitrary size, line size and associativity • Complemented with the Delphi CPU model • Optimization module: optimal tile size selection
Modeling Times(O200, R10000 180MHz) Aditional 0.2 to 2.5 seconds for syntactical analysis, etc.
Optimal Tile Size Search in the SPECfp95 and Perf. Bench. Codes • Uses memory model + Delphi CPU model • Environment: Origin 200 with R10000 • Processor parameters known for Delphi • Good compiler: MIPSpro 7.3.1.1m • Objective: generate code faster than that of the production compiler replacing the tile sizes it has chosen by those proposed by the model
Problems in the Experiment • In these codes only the last row and/or column is reused, rather than the whole tile • Base addresses of the data structures are not available • The data sets of several of the codes fit in the second level cache (1 MB) • The execution time of some of the loops modified is too small to be meaningful, so the whole application was measured
Related Work • Other models: • Ghosh and col.: CME (Cache Miss Equations), linear Diophantine equations. • Vera and Xue: statistical sample of CMEs • Chatterjee and col: Presburger formulae • Harper and col.: cache footprints • Other prediction tools: • Delphi • SPLAT
Conclusions • General strategy for the modeling of the memory hierarchy behavior • Good precision: average miss ratio prediction error about 0.1% • Very fast: milliseconds for SPECfp95 codes • Complemented with CPU model to predict real execution times • Competitive with a good production compiler
Current / Future Work • Trying/optimizing in different platforms • successful Pentium IV experiments • Extension to model codes with conditionals • Further extension to model indirections • SIGMETRICS’98, Europar’98