Download
1 / 14
140 likes | 364 Vues
Using the Model to Evaluate Observation Locations and Parameter Information in the Context of Predictions. Data Worth and Predictions. Predictions: Most models are developed with the intention of making predictions about future system behavior

E N D
Using the Model to Evaluate Observation Locations and Parameter Information in the Context of Predictions
Data Worth and Predictions Predictions: • Most models are developed with the intention of making predictions about future system behavior • Predictions can also be posed as some unknown occurrence at some location in the model domain that can be simulated by the model – such as flow in an unmonitored stream reach Approach : • The best possible model is developed and calibrated under the assumption that a model that reproduces past system response and system properties makes reliable predictions • But does the best fitting model always produces the best predictions? Evaluations (questions we should ask!): • How much uncertainty accompanies simulated predictions? • Which observations and parameters most influence the value of this predictive uncertainty?
Predictions – Death Valley Model: • Hydrogeology described by many parameters • Large number of head and flow observations to calibrate the model Prediction: • Groundwater flow directions and velocities in the Yucca Flats area
Predictions – Death Valley Prediction • Advection is often the dominant aspect of groundwater transport • Advection can be simulated using particle tracking or path lines • This is available within MODFLOW using the Advection (ADV) package • MODFLOW can also provide sensitivities pertaining to the pathway
Predictions – Advection Prediction • Specifically – MODFLOW calculates the travel path in three directions: • X - East-West • Y - North-South • Z - Up-Down • Using calculations described later, the variance of these predictions can be easily determined
Parameters – Predictions (PPR) 1. Parameter Information • Which parameters are most important to predictions • What information might be cost-effectively collected to further reduce predictive uncertainty?
Observations – Predictions (OPR) 2. Observation Locations • Existing observations: Which existing observation locations are most influential? • New observations: Where could new measurements be made to reduce predictive uncertainty?
Data Worth and Predictions Evaluations: • How much uncertainty accompanies simulated predictions? • Evaluate deterministically – trial and error sensitivity. • Evaluate using multiple models and Monte-Carlo methods • Evaluate using statistics – variance, standard deviation • Which parameters and observations are most influential in the calculation of this predictive uncertainty? • Statistical methods enable rapid evaluation of the contribution of (a) parameters and / or (b) observations to the uncertainty (standard deviation) of one or more predictions • First order second moment (FOSM) methods • First order – linear sensitivities • Second moment – variances and standard deviations
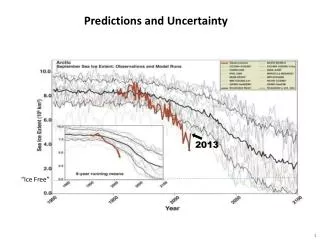
Predictions – Uncertainty Standard Deviation • Measure of spread of values for a variable • Has a stochastic basis • Involves assumptions • Regardless – a means for comparing relative predictive uncertainty Normal distribution
Data Worth and Predictions Approach: • Define the prediction: • How can we simulate the predicted quantity? • How can we summarize the ‘value’ of the prediction numerically? • Gather information obtained through calibration: • Observation sensitivities and weights • Prior information on parameters • Calculate prediction sensitivities: • Using methods similar to when calculating observation sensitivities • Include all parameters if possible • calibrated parameter values • measured parameter values
Data Worth and Predictions Approach: • Calculate the current prediction variance • Calculate a hypothetical prediction variance assuming changes to (a) information about parameters or (b) available observations • The Parameter-PRediction (PPR) Statistic: • Evaluate worth of potential knowledge about parameters, posed in the form of prior information - add this to calculations • The Observation-PRediction (OPR) Statistic: • Evaluate existing observation locations by omitting them from the calculations • Evaluate potential new observation locations by adding them to the calculations [1- (sznew /sz)] x 100 Note: PPR was called Value of Improved Information (VOII) in one journal article
Data Worth and Predictions Approach: • Recently encapsulated in a program: • OPR-PPR Program • In review • Class Exercise will use the OPR and PPR methods with a synthetic model that is described both in the OPR-PPR documentation, and in Hill and Tiedeman (2007)
Relevant References Tiedeman, C.R., Hill, M.C., D’Agnese, F.A., and Faunt, C.C., 2003, Methods for using groundwater model predictions to guide hydrogeologic data collection, with application to the Death Valley regional ground-water flow system: Water Resources Research, 39(1): 5-1 to 5-17, 10.1029/2001WR001255. (The PPR statistic is the same as what is called the VOII statistic in this paper) Tiedeman, C.R., D.M. Ely, M.C. Hill, and G.M. O'Brien, 2004, A method for evaluating the importance of system state observations to model predictions, with application to the Death Valley regional groundwater flow system, Water Resources Res., 40, W12411, doi:10.1029/2004WR003313. Tonkin, M.J., Tiedeman C.R., Ely, D.M., and Hill M.C., (in press), Documentation of OPR-PPR, a Computer Program for Assessing Data Importance to Model Predictions Using Linear Statistics, Constructed using the JUPITER API, JUPITER: Joint Universal Parameter IdenTification and Evaluation of Reliability API: Application Programming Interface, U.S. Geological Survey Techniques and Methods Report TM6-E2.