Download
1 / 11
110 likes | 296 Vues
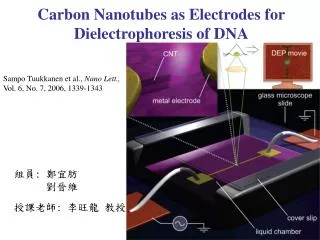
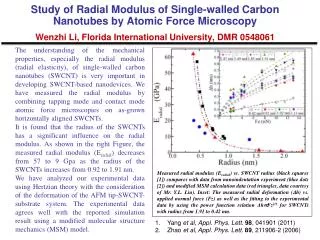
Carbon Nanotubes as Electrodes for Dielectrophoresis of DNA. Sampo Tuukkanen et al., Nano Lett., Vol. 6, No. 7, 2006, 1339-1343. 組員 : 鄭宜肪 劉晉維. 授課老師 : 李旺龍 教授. -q. +q. Dielectrophoretic (DEP) Technology.

E N D
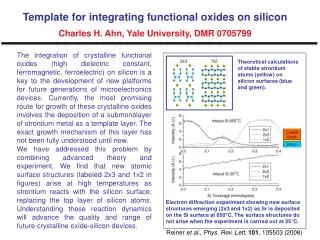
Carbon Nanotubes as Electrodes for Dielectrophoresis of DNA Sampo Tuukkanen et al., Nano Lett., Vol. 6, No. 7, 2006, 1339-1343 組員: 鄭宜肪 劉晉維 授課老師: 李旺龍 教授
-q +q Dielectrophoretic (DEP) Technology • Conventional dielectrophoresis, as first defined by Pohl, is the motion imparted on electrically polarised particles subjected to non-uniform electric fields. Dipole moment -We defined the product of the charge q and the vector d (going from – q to + q) as the electric dipole moment + -
+ + + + + + + + + + + + + + - - - - + + - + - + - - - + - + + + - - + + + - - + + + + + - - - - + + + + + + - - + + - - - - + + + + + + + + + + Dielectric Sphere in a Uniform Electric Field - - - + + + - - - A - - B - + + + - - + + + - - - - + + + + + + - - - + + + _ _ _ _ _ _ _ _ _ _ _ _ _ _ _ _ _ _ _ _ _ _ Polarisability: particle A > particle B
_ _ _ _ _ A + m + + + + + + + _ m B _ _ DEP Force by Non-uniform Field FDEP = 2 m r3 Re[ fCM (ω)] E2 r: particle radius fCM (ω) = (εp* – εm* / εp* + 2εm*) : Clausius - Mossitti factor ε * = ε - jσ /ω, σ: conductivity,ε:permittivity ω= 2πf, f : frequency Re[K()]> 0 : positive DEP Re[K()]< 0 : negative DEP + |εp *| > | εm*| |εp*| < | εm* | Medium - Plate electrode
Brownian motion displacement 2D Planar Electrode Manipulation of Minimum Particle Size What’s size of particle can be manipulated at fixed electric field condition ?
Electric Field Simulation Figure 2. Contour plot of the gradient of the field square, r(Erms2), in the plane 2 nm above the substrate surface, i.e., 0.2 nm above the CNT in (a-c). The DEP force has the maximum value in the very end of the CNT in (a-c). In (a), and the close-up (b), the gap size is 1 mm and in (c) and (d) the gap size is 100 nm. The dc voltage between the electrodes is 1.6 Vrms. The scale bars are 200 nm in (a) and 50 nm in (b-d).
Electrode-CNT and Trapped DNA by DEP Force Figure 3. DEP of 1065 bp dsDNA using CNT as one electrode: (a) SEM and (c) AFM images of the multiwalled CNT electrode sample before confocal experiment. (b) and (d) show the trapped DNA spot when a certain frequency and voltage were used.
DEP of 145 bp dsDNA Using CNT as an Electrode Figure 4. DEP of 145 bp dsDNA using CNT as an electrode. (a) and (b) are SEM images of the CNT electrode samples and (c) and (d) are corresponding fluorescence images taken during the DEP, using the shown frequency and voltage. The gap sizes are in (a) 115 nm and in (b) 350 nm.
Comparison of the Trapping Efficiency of CNT Electrode vs Finger-tip Electrodes Figure 5. The curves show the fluorescence (a) in the end of CNT (with electrode separation d ) 1 ím) and (b) in the gap (in the case of finger-tip metal electrodes separation d ) 100 nm) as a function of the electric field (an average electric field strength between the electrodes, E ) V/d). Dotted lines in (a) are fits to the data using the function I ) I0 + A(Vb + Vmin b)2/b (see text). By comparing the field strength needed to trap DNA in these cases, one can clearly see that CNT electrode shows better performance than lithographically fabricated nanoelectrodes.
Polarizability of 1065 bp DNA with Different Frequency Figure 6. Polarizability of 1065 bp DNA calculated from the fluorescence data captured during DEP using CNT electrode sample shown in Figure 3. The error bars originate from the uncertainty of the observed fluorescence spot radius (0.5 ( 0.1 ím). Other values are taken from refs 20, 23, and 24.
Summary and Conclusion • CNT as an electrode for dielectrophoretictrapping of nanometer • scale DNA molecules givens better performance compared to • nanolithography fabricated electrode trapping due to high field • produced. • 2. The polarizability and their frequency dependence can be • calculated using the in-situ confocal microscope data. • 3. Further studies are needed concerning the frequency and the • size dependence of DNA DEP efficiency. Thank you for your attention!


![[1] J. Zhang et al. , Appl. Phys. Lett . 88 , 123112 (2006).](https://cdn2.slideserve.com/3783086/slide1-dt.jpg)