Download
1 / 1
10 likes | 109 Vues
This study evaluates street trees at Indiana University-Bloomington, quantifying costs, benefits, and management practices. Recommendations are made for a sustainable tree population. Data collected through i-Tree Streets software application reveals insights into tree mulching, species demographics, and tree age distribution for future research. The study emphasizes the importance of proper maintenance practices to maximize ecosystem services provided to the campus community.

E N D
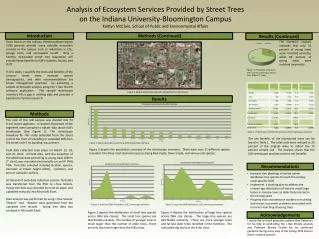
Analysis of Ecosystem Services Provided by Street Trees on the Indiana University-Bloomington Campus Kaitlyn McClain, School of Public and Environmental Affairs Methods (Continued) Introduction Results (Continued) Trees found on the Indiana University-Bloomington (IUB) grounds provide many valuable ecosystem services to the campus such as reductions in CO2, energy costs, and stormwater runoff. Only a healthy, sustainable street tree population will provide these benefits to IUB’s students, faculty, and staff. In this study, I quantify the costs and benefits of the campus’ street trees, evaluate species demographics, and offer recommendations for future management practices by executing a sample streetscape analysis using the i-Tree Streets software application. This sample streetscape inventory fills a gap in existing data and provides a baseline for further research. The inventory analysis indicates that only 32 percent of young trees were mulched correctly, while 68 percent of young trees were mulched incorrectly . Figure 5: Proportion of correct and incorrect mulching in young trees (DBH ≤ 2” class) Figure 1: Map of streetscape segments sampled on the IUB campus Results Methods The core of the IUB campus was divided into 74 0.1mi street segments. A random 20 percent of the segments were sampled to obtain data about IUB’s streetscape (See Figure 1). The streetscape boundary for this study extended from the street curb to the front of a building or extended 50ft from the street curb if no building was present. Field data collection took place on March 15, 18, and 25, 2012. All field data, with the exception of the additional data pertaining to young trees (DBH ≤ 2” class), was recorded electronically on an HP iPAQ PDA. Tree data collected included location, species, diameter at breast height (DBH), condition, and wire or sidewalk conflicts. At the end of each data collection session, field data was transferred from the PDA to i-Tree Streets. Young tree data was recorded by hand on paper and uploaded manually into Microsoft Excel. Data analysis was performed by using i-Tree Streets’ “Report” tool. Reports were generated from the uploaded tree records. Young tree data was analyzed in Microsoft Excel. Table 1: i-Tree Streets net benefit summary, 2012 streetscape inventory The net benefits of the inventoried trees can be found in Table 1. The total costs were reduced to 20 percent of the original value to reflect the 20 percent sample size. The analysis shows that the IUB streetscape provides positive net benefits. Figure 2: Species population summary, 2012 streetscape inventory Figure 2 depicts the population summary of the streetscape inventory. There were over 21 different species recorded. The three most dominant species being Red maple, Silver maple, and various oak species. Recommendations • Increase tree plantings of varied native deciduous tree species to reach the canopy cover goal by 2020 • Implement a planting plan to address the uneven age distribution of trees to avoid large losses in canopy cover as older trees are lost in the coming years • Properly train maintenance workers in mulching techniques to prevent problems associated with incorrect mulching of young trees Figure 3: Small tree DBH distribution, 2012 streetscape inventory Figure 3: Large tree DBH distribution, 2012 streetscape inventory Figure 3 depicts the distribution of small tree species across DBH size classes. The small tree species are distributed unevenly. The number of younger trees is much larger than the number of older trees. There are only two trees larger than the 6-8in class. Figure 4 depicts the distribution of large tree species across DBH size classes. The large tree species are distributed unevenly. There are more younger trees and far less older trees recorded in the inventory. The noticeable dip starts at the 6-8in class. Acknowledgements I would like to thank graduate student Matt Patterson for his help in conducting the i-Tree Streets analysis and Professor Burney Fischer for his continued guidance during every step of the Spring 2012 Honors thesis research process.


