Download
1 / 37
380 likes | 572 Vues
Tanker Markets Overview. 31 May 2010, Jeddah Peter M Swift, MD, INTERTANKO. INTERTANKO Today. 260 + members operating ca. 3,100 ships > 75% of the independent oil tanker fleet and > 85% of the chemical carrier fleet 300 + associate members: in oil and chemical tanker related businesses

E N D
Tanker MarketsOverview 31 May 2010, Jeddah Peter M Swift, MD, INTERTANKO
INTERTANKO Today 260 + members operating ca. 3,100 ships > 75% of the independent oil tanker fleet and > 85% of the chemical carrier fleet 300 + associate members: in oil and chemical tanker related businesses 15 Committees – 5 Regional Panels Principal Offices – London and Oslo Representative Offices in US, Asia and Brussels Observer Status at IMO, IOPC, OECD and UNCTAD International Association of Independent Tanker Owners
Global dependence on oil tanker transportation World Oil Consumption 3.8 billion ts Transported by sea 2.4 billion ts > 60% transported by sea
Tanker shipping today- an industry to be proud of • Safe • Environmentally responsible • Energy efficient • Cost effective
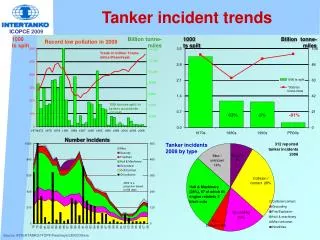
Accidental oil pollution from tankers 1000 ts spilt 1000 bn tonne miles trade Based on ITOPF/Fearnleys
Tanker Shipping’s GREEN Credentials • This car, weighing one tonne, uses 1 litre of fuel to move 20 kms • This oil tanker uses 1 litre of fuel to move one tonne of cargo 2,500 kms • more than twice as far as 20 years ago
Oil price and freight rates 1970-2010– real and nominal USD per barrel Source: OPEC/US pub. stats
Investment in New Tonnage- Move to Double Hulls • More than USD 500 billion invested since 2000 with the result that ~95% of tanker fleet* double hulled by end 2010 * over 10,000 dwt
Average age tanker fleet above 10,000 dwt Years Based on LRFairplay
Key Challenges for Tanker and other Ship Owners Today • Establishing and maintaining an international framework of consistent regulations and standards • Delivering best environmental performance • Ensuring availability of good people (and quality ships) • Ensuring the welfare and well-being of ships’ crews • Meeting the challenges of Piracy
Key Environmental Challenges • Air emissions - Green House Gases - Exhaust Gas emissions (Annex VI & its revisions) - VOC emissions • Spill Prevention and Response Planning • Ballast Water management • Biofouling • Antifouling systems • Ship Recycling • Port Reception Facilities (adequacy & affordability) • Waste management (onboard and ashore) • Radiated Noise pollution • Cetacean strikes
Tanker Markets Today ? • Demand down, but recovering ? • Supply up, and still growing ? • Rates down, and ?
Tanker Markets Today • Demand : World oil trade • Supply : Ships on Order & Fleet development • Tanker market • Shipbuilding capacity
World Oil Demand vs. GDP 6 5 4 3 2 % change (year on year) 1 IMF GDP Oil Demand 0 -1 -2 -3 -4 1991 1992 1993 1994 1995 1997 1998 1999 2001 2003 2004 1990 1996 2000 2002 2005 2010 1989 2009 1981 1983 1984 1985 1986 1987 2006 2007 2008 1982 1988 Source: Clarksons (September 2009)
Demand uncertainties • Global or regional economic stagnation • New pipelines • Natural and other disasters • Climate Change legislation • Oil price • Inventory levels Eastern Siberian Pacific Ocean Pipeline
Orderbook Development (All ship types) Orderbook – All ships (>999GT) Source: Clarksons, April 2010
Orderbook by ship type(as % existing fleet) Source: Clarksons (September 2009)
Tanker Contracting 1996-2010 90 80 Handy 70 MR 60 50 Panamax million deadweight 40 Aframax 30 Suezmax 20 10 VLCC 0 2007 2008 2009 2001 2002 2003 2004 2005 2006 2010 1996 1997 1998 1999 2000 Source: Clarksons, April 2010
Newbuilding Tanker Prices VLCC Suezmax Aframax Panamax MR Product 180 150 120 $ million 90 60 30 0 Jan-86 Jan-88 Jan-90 Jan-92 Jan-94 Jan-96 Jan-98 Jan-00 Jan-02 Jan-04 Jan-10 Jan-76 Jan-78 Jan-80 Jan-82 Jan-84 Jan-06 Jan-08 Source: Clarksons, April 2010
Tanker Fleet Development 550 500 450 10-24 tanker 400 handy 350 MR 300 deadweight (million) Panamax 250 Aframax Suezmax 200 VLCC 150 100 50 0 1984 1986 1988 1990 1992 1994 1996 1998 2000 2002 2012 1982 1970 1972 1974 1976 1978 1980 2004 2006 2008 2010 Source: Clarksons (September 2009)
Tanker Age Profile 500 400 Handy MR 300 no of vessels Panamax 200 Aframax Suezmax 100 VLCC 0 1989 1990 1991 1992 1993 1994 1995 1996 1997 1998 1999 2000 2001 2002 2003 2004 2005 2006 2007 2013 2014 1980 1981 1982 1983 1984 1985 1986 1987 1988 2008 2009 2010 2011 2012 1970-1974 1975-1979 Source: Clarksons, April 2010
Tanker Fleet Comparisons non-double hull On Order Built since 2000 80 70 75 73 69 69 68 60 58 50 40 percentage of exisiting fleet 38 30 33 29 20 21 19 20 10 13 12 6 5 9 6 0 VLCC Suezmax Aframax Panamax MR Handy Source: Clarksons, April 2010
Where next for Single Hull Tankers ? Current trading status 100% 90% Storage% 80% 70% Inactive% 60% 50% % of single hull fleet Domestic 40% Trading% 30% 20% Normal Trading% 10% 0% VLCC Suezmax Aframax Panamax MR Handy Total Fleet Source: Clarksons, April 2010 (datasource: Clarksons/LLI)
Where next for Single Hull Tankers ? • Trading beyond 2010 ? • Flag/Port State positions re MARPOL 13G trading up to the age of 25 years Australia No China No EU No Mexico No Romania No S Korea No* Philippines No* UAE No* (*No official note sent to IMO yet) Bahamas Yes Barbados Yes Liberia Yes Marshall Isl. Yes Panama Flag Yes Japan Yes Singapore Yes India Yes Hong Kong Yes** (** Max. 20 years old) United States N/A (OPA90)
Average tanker freight rates(based on the Baltic rates) USD/Day Source: Baltic Exchange/INTERTANKO May 2010
Lower Freight Rates & Fleet surpluses Implications ? • Challenge to maintain quality and standards, - e.g. maintenance, training • Challenge to address the issues of the day – e.g. including environmental challenges Potentially made even worse if new ships are of low standard ?
Shipbuilding capacity • A future unknown factor !
Shipbuilding output and forecast m cgt Source: Worldyards/INTERTANKO Aug 09
Shipbuilding output potential m cgt Worldwide estimates in m cgt - small and big ships (Aug 09) Source: Worldyards/INTERTANKO Aug 09
Shipyard output potential - surplus Implications ? • Distressed sales / lower prices • Quality and standards maintained or weakened • Pressure on suppliers and sub-contractors • Greater customer focus & customisation • and any government interventions ?
or Market Forecast !
Thank you اﺮﻜﺷ For more information, please visit: www.intertanko.com www.maritimefoundation.com www.poseidonchallenge.com www.shippingfacts.com London, Oslo. Washington, Singapore and Brussels
Tanker Incidents and accidental pollution Number incidents ‘000 ts pollution Based on data from LMIU, ITOPF + others
Fleet Growth 2000-2009 2009 2010 2011 20 15 10 % change y-o-y 5 0 -5 VLCC Smax Amax Pmax MR Handy *Includes slippage, cancellation and removal ideas Source: Clarksons, April 2010
VLCCs* deliveries and deletions Number 1966 Idemitsu Maru, the first VLCC delivered by IHI, 206,000 dwt 1976 Seawise Giant, the largest tanker delivered by Sumitomo H.I , 564,650 dwt 1974 the largest number of VLCCs delivered, 124 1982 only one VLCC was delivered *Here VLCCs include all tankers above 200,000 dwt ** trading include short term storage, not lay-up or long term storage Source: INTERTANKO , LR Fairplay current fleet, Clarkson deliveries
Tanker sales for demolitionand VLCC freight rate 30 100,000 VLCCs sales for demolition <200,000 dwt sales for demolition** VLCC freight rate*** 24 80,000 18 60,000 12 40,000 6 20,000 0 0 85 86 87 88 89 90 91 92 93 94 95 96 97 98 99 00 01 02 03 04 05 06 07 08 09* USD / day m dwt • * Until week ending 4 September • ** Sales for demolition until 4 September • *** Clarkson Freight rate AG-Japan week ending 4 September Source: INTERTANKO