Download
1 / 69
730 likes | 1.04k Vues
Lectures on Medical Biophysics Dept. Biophysics, Medical faculty, Masaryk University in Brno. Ultrasound diagnostics. Lectures on Medical Biophysics Department of Biophysics, Medical Faculty, Masaryk University, Brno. Lecture outline.

E N D
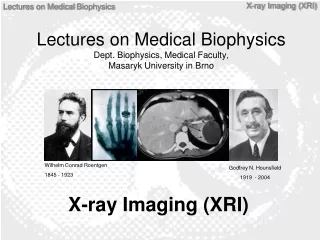
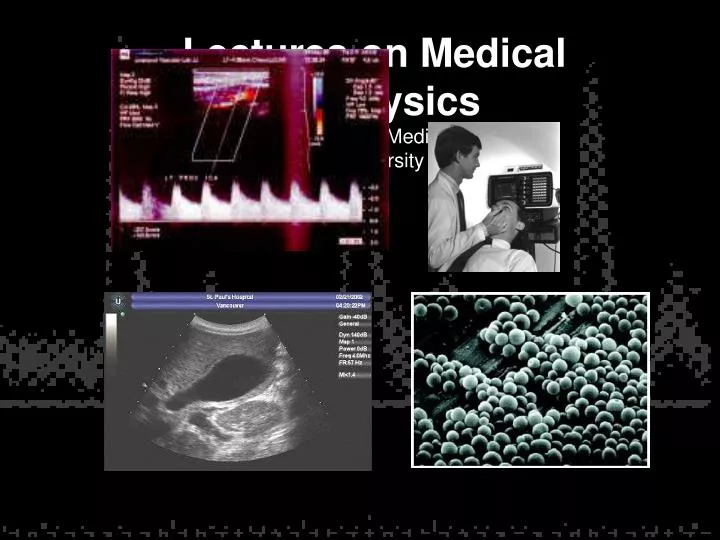
Lectures on Medical BiophysicsDept. Biophysics, Medical faculty, Masaryk University in Brno
Ultrasound diagnostics Lectures on Medical BiophysicsDepartment of Biophysics, Medical Faculty, Masaryk University, Brno
Lecture outline • Physical properties of ultrasound and acoustic parameters of medium • Ultrasonography • Impulse reflection method • A-mode – one-dimensional • B-mode – two-dimensional • M-mode • Basic characteristics of US images • Interventional sonography • Echocontrast agents • Harmonic imaging • Principle of 3D imaging • Doppler flow measurement • Principle of Doppler effect • Principle of blood flow measurement • CW Doppler system • Systems with pulsed wave – PW Doppler • Duplex and Triplex methods • Power Doppler method • Tissue Doppler Imaging (TDI) • Ultrasonic densitometry • Patient Safety: reducing Ultrasound ‘Doses’
Ultrasound diagnostics • Ultrasound diagnostics started to develop in early 50‘ of 20th century. It allows to obtain cross-sectional images of the human body which can also include substantial information about its physiology and pathology. • Ultrasound diagnostics is based mainly on reflection of ultrasound waves at acoustical interfaces • We can distinguish: • Ultrasonography (A, B and M mode, 3D and 4D imaging) • Doppler flow measurement, including Duplex and Triplex methods (Duplex, Colour Doppler, Triplex, Power Doppler) • Tissue Doppler imaging • Ultrasound densitometry
Physical properties of ultrasound Before we will deal with diagnostic devices, we need to understand what is ultrasound and what are the main acoustical properties of medium. Ultrasound (US) is mechanical oscillations with frequency above 20 kHz which propagate through an elastic medium. In liquids and gases, US propagates as longitudinal waves. In solids, US propagates also as transversal waves.
Interactions of US with Tissue • Reflection (smooth homogeneous interfaces of size greater than beam width, e.g. organ outlines) • Rayleigh Scatter (small reflector sizes, e.g. blood cells, dominates in non-homogeneous media) • Refraction (away from normal from less dense to denser medium, note opposite to light, sometimes produces distortion) • Absorption (sound to heat) • absorption increases with f, note opposite to X-rays • absorption high in lungs, less in bone, least in soft tissue, again note opposite to x-rays • Interference: ‘speckles’ in US image result of interference between Rayleigh scattered waves. It is an image artefact. • Diffraction
Acoustic parameters of medium: Interaction of US with medium – reflection and back-scattering, refraction, attenuation (scattering and absorption)
Acoustic parameters of medium Speed of US c depends on elasticity and density r of the medium: K - modulus of compression in water and soft tissues c = 1500 - 1600 m.s-1, in bone about 3600 m.s-1
Acoustic parameters of medium Attenuationof US expresses decrease of wave amplitude along its trajectory. It depends on frequency Ix = Io e-2ax = ´.f2 Ix – final intensity, Io – initial intensity, 2x – medium layer thickness (reflected wave travels „to and fro“), - linear attenuation coefficient (increases with frequency). Since a = log10(I0/IX)/2x we can express in units dB/cm. At 1 MHz: muscle 1.2, liver 0.5, brain 0.9, connective tissue 2.5, bone 8.0
attenuation I or P [dB] depth[cm] Acoustic parameters of medium Attenuation of ultrasound When expressing intensity of ultrasound in decibels, i.e. as a logarithm of Ix/I0, we can see the amplitudes of echoes to decrease linearly.
Acoustic parameters of medium Acoustic impedance: product of US speed c and medium density r Z = . c (Pa.s/m) Z.10-6: muscles 1.7, liver 1.65 brain 1.56, bone 6.1, water 1.48
Acoustic parameters of medium:US reflection and transmission on interfaces We suppose perpendicular incidence of US on an interface between two media with different Z - a portion of waves will pass through and a portion will be reflected (the larger the difference in Z, the higher reflection). P1 Z 2 - Z 1 R = ------- = --------------- P Z2 + Z1 P2 2 Z 1 D = ------- = --------------- P Z2 + Z1 Coefficient of reflection R – ratio of acoustic pressures of reflected and incident waves Coefficient of transmission D – ratio of acoustic pressures of transmitted and incident waves
Acoustic parameters of medium:Near field and far field • Near field (Fresnel area) – this part of US beam is cylindrical – there are big pressure differences in beam axis • Far field (Fraunhofer area)– US beam is divergent – pressure distribution is more homogeneous • Increase of frequency of US or smaller probe diameter cause shortening of near field - divergence of far field increases
Ultrasonography Passive US – low intensity waves which cannot cause substantial changes of medium. In US diagnostics (ultrasonography = sonography = echography) - frequencies used are 2 - 40 MHz with (temporal average, spatial peak) intensity of about 1 kW/m2 Impulse reflection method: a probe with one transducer which is source as well as detector of US impulses. A portion of emitted US energy is reflected on the acoustic interfaces and the same probe then receives reflected signal. After processing, the signal is displayed on a screen.
Ultrasonography Impulse reflection method
Ultrasonography Impulse reflection method
Ultrasonography Impulse reflection method • Main parts of the US apparatus: • Common to diagnostics and therapy • probe with electroacoustic transducer (transducers) • generator of electric oscillations (continuous, pulsed) • Special parts of diagnostic apparatus • electronic circuits for processing of reflected signal • display unit • recording unit
Ultrasonography A-mode – one-dimensional • Distances between reflecting interfaces and the probe are shown. • Reflections from individual interfaces (boundaries of media with different acoustic impedances) are represented byvertical deflectionsof base line, i.e. the echoes. • Echo amplitude is proportional to the intensity of reflected waves (Amplitude modulation) • Distance between echoes shown on the screen is approx. proportional to real distance between tissue interfaces. • Today used mainly in ophthalmology.
Ultrasonography A-mode – one-dimensional
Ultrasonography B-mode – two-dimensional A tomogram is depicted. Brightness of points on the screen represents intensity of reflected US waves (Brightness modulation). Static B-scan: a cross-section image of examined area in the plane given by the beam axis and direction of manual movement of the probe on body surface. The method was used in 50‘ and 60‘ of 20th century
Ultrasonography B-mode – two-dimensional - static
chest wall lungs Ultrasonography M-mode One-dimensional static B-scan shows movement of reflecting tissues. The second dimension is time in this method. Static probe detects reflections from moving structures. The bright points move vertically on the screen, horizontal shifting of the record is given by slow time-base. Displayed curves represent movement of tissue structures
Ultrasonography Comparison of A-, B- and M-mode principle
Ultrasonography B-mode - dynamic Repetitive formation of B-mode images of examined area by fast deflection of US beam mechanically (in the past) or electronically „in real time“ today. Electronic probes consist of many piezoelectric transducers which are gradually activated.
UltrasonographyB-mode - dynamic Ultrasound probes for dynamic B-mode: electronic and mechanical (history), sector and linear. Abdominal cavity is often examined by convex probe – a combination of a sector and linear probe.
MEMORY sampling UltrasonographyB-mode - dynamic • Modern ultrasonography - digital processing of image • Analogue part – detection system • Analogue-digital converters (ADC) • Digital processing of signal – possibility of programming (preprocessing, postprocesssing), image storage (floppy discs, CD, flash cards etc.)
Ultrasonography Basic characteristics of US images Degree of reflectivity – echogenity. The images of cystic (liquid-filled) and solid structures are different. According to the intensity of reflection in the tissue bulk we can distinguish structures: hyperechogenic, izoechogenic, hypoechogenic, anechogenic. • Solid structures – acoustic shadow (caused by absorption and reflection of US) • Air bubbles and other strongly reflecting interfaces cause repeating reflections (reverberation, „comet tail“).
Ultrasonography Acoustic shadow caused by absorption and reflection of US by a kidney stone (arrow) Hyperechogenic area below a cyst (low attenuation of US during passage through the cyst compared with the surrounding tissues – arrow)
Ultrasonography Spatial resolutionof US imaging system is determined by the wavelength of the US. When the object dimension is smaller than this wavelength only scattering occurs. Hence higher spatial resolution requires higher frequencies Limitation! – absorption of US increases with frequency of ultrasound = smaller penetration depth Compromise frequency 3-5 MHz – penetration in depth of about 20 cm
UltrasonographySpatial Resolution • Axial spatial resolution - it is given by the shortest distance of two distinguishable structures lying in the beam axis – it depends mainly on frequency (at 3.5 MHz about 0.5 mm) • Lateral spatial resolution - it is given by the shortest distance of two distinguishable structures perpendicularly to the beam axis – depends on the beam width • Elevation – ability to distinguish two planes (sections) lying behind or in front of the depicted tomographic plane – it depends on frequency and beam geometry
Ultrasonography Spatial Resolution • The best resolving power can be found in the narrowest part of the US beam profile. • Focusing – US beam is converged at the examined structure by means of acoustic lenses (shapes of the layer covering the transducer) or electronically. • The probes can be universal or specially designed for different purposes with different focuses. • The position of focus can be changed in most sector probes).
UltrasonographyInterventional sonography • Interventional sonography is used mainly for guiding punctures • diagnostic – thin needle punctures to take tissue samples for histology • therapeutic – for aspiration of a cyst or an abscess content or an exudate etc. • Puncture can be done by „free hand“ – the probe is next to the puncture site – or the puncture needle is guided by a special probe attachment.
UltrasonographyEchocontrast agents - increase echogenity of streaming blood Gas microbubbles (mainly air or volatile hydrocarbons) - free - enclosed in biopolymer envelope A SEM micrograph of encapsulated echocontrast agent
UltrasonographyEchocontrast agents - application Enhanced demarcation of heart ventricle after application of the echocontrast agent
Ultrasonography Harmonic imaging An impulse with basic frequency f0 is emitted into the tissue. The receiver, however, does not detect the reflected US with this same frequency but with the second harmonic frequency 2f0. Its source is tissue itself (advantage in patients „difficult to examine“). The method is also used with echocontrast agents – source of the second harmonic are oscillating bubbles. Advantageous when displaying blood supply of some lesions. Conventional (left) and harmonic (right) images of a kidney with a stone.
Ultrasonography Principle of three-dimensional (3D) imaging - The probe is linearly shifted, tilted or rotated. The data about reflected signals in individual planes are stored in memory of a powerful PC which consequently performs mathematical reconstruction of the image. Disadvantages of some 3D imaging systems: relatively long time needed for mathematical processing, price.
Doppler flow measurement The Doppler effect (frequency shift of waves formed or reflected at a moving object) can be used for detection and measurement of blood flow, as well as, for detection and measurement of movements of some acoustical interfaces inside the body (foetal heart, blood vessel walls) Christian. A. Doppler (1803-1853), Austrian physicist and mathematician, formulated his theory in1842 during his stay in Prague.
Doppler flow measurement • Principle of Doppler effect perceived frequency corresponds with source frequency in rest perceived frequency is higher when approaching perceived frequency is lower when moving away
Doppler flow measurement • Principle of Doppler effect Application of Doppler effect in blood flow velocity measurement Moving reflector (back scatterer) = erythrocytes
Doppler flow measurement • Principle of blood flow measurement US Doppler blood flow-meters are based on the difference between the frequency of ultrasound (US) waves emitted by the probe and those reflected (back-scattered) by moving erythrocytes. The frequency of reflected waves is (in comparison with the emitted waves) higher in forward blood flow(towards the probe) lower in back blood flow(away from the probe) The difference between the frequencies of emitted and reflected US waves is proportional to blood flow velocity.
Doppler flow measurement General principle of blood flow measurement
Doppler flow measurement • Calculation of Doppler frequency change fd • Calculation of „reflector“ (erythrocytes) velocity v • 1) 2) • fv- frequency of emitted US waves • α- angle made by axis of emitted US beam and the velocity vector of the reflector • c– US speed in the given medium (about 1540 m/s in blood)
Doppler flow measurement Dependence of velocity overestimation on the incidence angle α(if the device is adjusted for a = 0, i.e. cosa = 1) a - angle made by axis of emitted US beam and the velocity vector of the reflector
Doppler flow measurement • Systems with continuous wave – CW. They are used for measurement on superficial blood vessels. High velocities of flow can be measured, but without depth resolution. Used only occasionally. • Systems with pulsed wave. It is possible to measure blood flow with accurate depth localisation. Measurement of high velocities in depths is limited.
Doppler flow measurement Systems with pulsed wave - PW The probe has onlyone transducerwhich acts alternately as emitter and receiver. The measurement of velocity and direction of blood flow in the vessel is evaluated in the so-calledsampling volume with adjustable size and depth. The pulse duration defines the size of the sampling volume (this volume should involve the whole diameter of the examined blood vessel).
Nyquist limit Doppler methods Pulse wave (PW) systems Aliasing – at high repetition frequency of pulses the upper part of the spectral curve can appear in negative velocity range - at velocity above 4m/s aliasing cannot be removed
Doppler methods DUPLEX method is a combination of dynamic B-mode imaging (the morphology of examined area with blood vessels is depicted) and the PW Doppler system (measurement of velocity spectrum of blood flow). It allows to examine blood flow inside heart or in deep blood vessels (flow velocity, direction and character)
Doppler methodsDUPLEX method • Scheme: sector image Image of carotid with spectral • with sampling volume analysis of blood flow velocity