Download

1 / 51
510 likes | 698 Vues
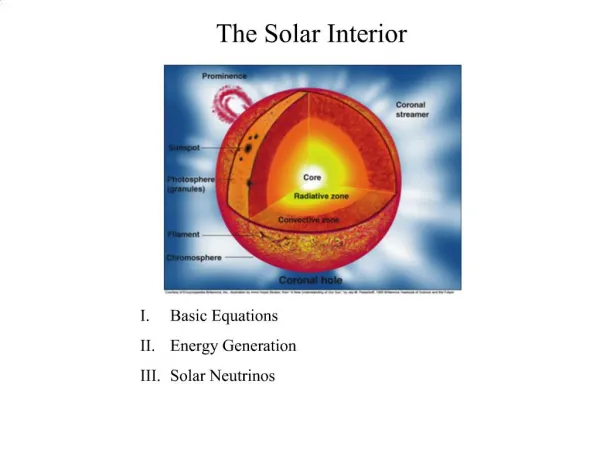
Probing the Solar Interior on Multiple Timescales Using Global Helioseismololgy. by. Edward Rhodes, University of Southern California and Jet Propulsion Laboratory Johann Reiter, Technical University Munich Sasha Kosovichev , Big Bear Solar Observatory, New Jersey Institute of Technology

E N D
Probing the Solar Interior on Multiple Timescales Using Global Helioseismololgy by Edward Rhodes, University of Southern California and Jet Propulsion Laboratory Johann Reiter, Technical University Munich Sasha Kosovichev, Big Bear Solar Observatory, New Jersey Institute of Technology JesperSchou, Tim Larson, and Phil Scherrer, Stanford University Stephen Pinkerton, University of Southern California HELAS VI/SOHO28/SPACEINN Conference on Helioseismology and Applications Max-Planck-Institute fur Sonnensysemforschung Gottingen, Germany September 2, 2014
Outline • Description of our methodology • Results of the study of short-term p-mode frequency and width shifts in response to changing levels of solar activity • Results of the study of longer term changes in the solar internal sound speed through inversion of long-duration frequency tables
Methodology • We have studied the temporal variations of the seismic properties of the Sun on both short and long timescales by generating tables of MDI, HMI, and GONG p-mode intermediate- and high-degree frequencies and widths that have come from both short- and long-duration observing time series that were obtained between mid-1996 and mid-2012. • First, we have generated and inter-compared a large number of tables of p-mode properties that have come from observing times series that were three days in duration. • Second, we have generated and inverted a total of 23 p-mode frequency tables of that have been computed from much longer time series of MDI and HMI observations each of which lasted from 1.5 to 3 months.
Summary of MDI Dynamics Run Power Spectral Datasets • MDI was operated in its Dynamics, or Full-Disk, Mode for a total of 15 different Dynamics Runs of varying durations between 1996 and 2010. • We have generated sets of Full-Disk power spectra for degrees up to 1000 that come from the entire duration ofall but two of theDynamics Runs that have high frequency resolution. • We have also divided each of the 15 Dynamics Runs into a series of three-day time intervals and we have generated a set of Full-Disk power spectra from each of these intervals which has much lower frequency resolution.
Summary of HMI Power Spectral Datasets • HMI was initially operated simultaneously with MDI during the 66-day long 2010 Dynamics Run. • Subsequently, the HMI observations have been divided into 21 72-day time series. • Un-averaged, high-degree power spectra have been computed from both the 72-day time series and three-day time series contained within each of the first nine 72-day intervals.
Summary of Available GONG High-Degree Power Spectral Datasets • GONG was upgraded to its current spatial resolution during 2001. • The GONG Project staff computed sets of un-averaged, high-degree power spectra that spanned several different time periods during that year.
Short-Term Study • We have studied the temporal variations of the seismic properties of the Sun on short timescales by studying the response of p-mode frequency and width changes to corresponding changes in the level of solar activity. • We have done so by generating a large number of frequency and width tables each of which has come from observational time series that were three days in duration.
Sort-term Variations in MDI, HMI, and GONG Intermediate- and High-Degree Frequencies and Widths • I will now highlight recent results derived from the fitting of m-averaged spectra. The results I will present were derived by regressing sets of binned differences in the fitted frequencies and widths upon differences in ten different solar activity indicators. These linear regression analyses were carried out for 25 different frequency bins for each of the datasets
Linear Regression Analyses of Binned Frequency Shifts Versus Changes in Magnetic Plage Strength Index, MPSI, at a Frequency Where Both Sets of Changes Were Correlated GONG, Fall-2001 MDI, 1996
Linear Regression Analyses of Binned Frequency Shifts Versus Changes in Magnetic Plage Strength Index, MPSI, at a Higher Frequency Where Both Sets of Changes Were Anti-Correlated MDI, 1996 GONG, Fall-2001
OurStudy of p-mode Frequency Shifts During Cycle 23 Shows a Continuous Variation in the Sensitivity of These Frequency Shifts To Changes In Solar Activity As a Function of Frequency. We have also Shown that the Frequencies Where the Frequency Shifts Change From Being Correlated With Activity Changes to Being Anti-Correlated Change with the Mean Level of Activity as shown below: 1996 Spring-2001 Spring-2001 Fall-2001 1996 Fall-2001
P-mode Linewidths Also Show a Similar, but Slightly Different Dependence Upon Solar Activity Changes as Shown Using GONG+ Data From Fall-2001
Comparison of Regression Slopes from Frequency and Width Shift Studies Frequency shift regression slopes Width shift Regression slopes Both +/- and -/+ Zero-Crossing Frequencies Are Lower for Width Shifts
Solar Cycle Dependence of Frequency and Width Zero-crossings • By repeating the above short-term analyses for every annual MDI Dynamics Run and for the first nine HMI 72-day observing intervals, we have been able to show that the “+/-” and “-/+” zero-crossing frequencies for both the frequencies and line widths vary systematically with the changing mean level of activity during each analysis interval.
Both our +/- (lower set) and -/+ (upper set) Zero-Crossing Frequencies That Came from the Temporal Shifts Of MDI, GONG+, and HMI p-Mode Frequencies Clearly Depend Upon the Mean Level Of Activity During Each of Our Time Intervals Regardless Of Our Use of Symmetric (Left) or Asymmetric (right) Profiles. These zero-crossing trends are likely Due To Solar Cycle Dependent Changes in the Acoustic Cutoff Frequency, Which Are Likely Caused Themselves By the Changing level of Magnetic Fields in the Solar Interior
Both our +/- (lower set) and -/+ (upper set) Zero-Crossing Frequencies That Came from the Temporal Shifts Of MDI, GONG+, and HMI p-Mode Linewidths Clearly Depend Upon the Mean Level Of Activity During Each of Our Time Intervals Regardless Of Our Use of Symmetric (Left) or Asymmetric (right) Profiles. The Linewidth Zero-crossings Occur at Lower Frequencies Than Do the Frequency Zero-Crossings.
Our Measured 2009 Solar Minimum Zero-Crossing Frequencies for the Changes in both the p-Mode Frequencies and in the p-Mode Widths Were Substantially Below All Previous and Subsequent Zero-Crossings
Our +/- zero-crossing frequencies are systematically higher than the so-called acoustic cutoff frequencies of Jimenez, Garcia, and Palle (2011), but both quantities show a similar solar cycle dependence during Cycle 23
Both our “+/-” zero-crossing frequencies and the “acoustic cutoff frequencies” of Jimenez, Garcia and Palle (2011) are correlated with each other although the zero-crossing Frequencies show a wider range of variations than do their measurements
Summary of Short-Term Frequency and Width Shift Discoveries • We have shown that the temporal p-mode frequency shifts have a systematic dependence upon the frequencies of the modes in which the shifts are correlated with changes in activity at the lower frequencies, but then become anti-correlated with the activity changes at higher frequencies, and may also return to being correlated with the activity changes at the highest frequencies
Summary of Short-Term Frequency and Width Shift Discoveries (cont.) • We have shown that the slopes of the width shifts change sign at different frequencies than do the slopes of the frequency shifts themselves. • We have shown that the frequencies where both the frequency shifts and the width shifts change sign (i.e., the so-called +/- and -/+ zero-crossing frequencies) also change with the changing level of overall level of solar activity from year to year. • We have shown that the zero-crossing frequencies are closer to the theoretical acoustic cutoff frequencies than are those of Jimenez, Garcia, and Palle.
Search for Temporal Changes in the Internal Solar Sound Speed • We have now generated sets of 45- to 94-day power spectra which came from all but two of the 15 of the annual MDI Dynamics Runs between 1996 through 2010, and we have also generated power spectra that were computed from nine HMI 72-day observing runs from mid-2010 through mid-2012. • We have employed our WMLTP method to fit each of these sets of m-averaged spectra. • We have identified a common set of roughly 6300 modes having frequencies between 900 and 4500 mHz that were present in all 23 frequency tables.
Complete Set of 12359 Intermediate- and High-Degree Frequencies Computed by Johann Reiter Using Latest Version of WMLTP Fitting Code on m-Averaged Spectra from 2010 MDI Dynamics Run. Subset of 6366 Frequencies of Degrees Up To 1000 That Ranged Between 0.9 and 4.5 mHz That Was Recently Inverted by Sasha Kosovichev Is Shown in Red
New Structural inversions of Both MDI and HMI Full-disk Frequency Tables • We carried out identical structural inversions for all 23 high-resolution frequency tables using the common mode set. • Most of the 23 input tables were inverted “as-is,” but after several of the inverted sound speed profiles showed non-solar oscillations in the radial profile of the sound speed in the deep interior, we cleaned five of the tables and repeated those inversions.
The Solar Subsurface Shear Layer • The solar subsurface, or near surface, shear layer was first identified by our group using observations of p-mode rotational frequency-splitting coefficients that were obtained at the Mount Wilson 60-Foot Solar Tower in 1994 by Steve Tomczyk. • Later Sylvain Korzennik acquired higher resolution observations at the 60-Foot Tower in 1988 and extended the observations of the shear layer closer to the solar surface.
Radial Profile of Equatorial Angular Velocity Computed From An Inversion of Frequency-splitting Coefficients Computed By JesperSchou of MDI Data Acquired During the 1996 Solar Minimum Which Shows the Solar Subsurface Shear Layer at the Right DR= Rsun -Rbase DW=Wmax-Wsurf Rbase/Rsun=0.94
We also studied the dependence of the squared sound speed deviations from Model S upon the mean level of solar activity during each of the 23 observing intervals. It is important to note that all three of the points that lie well above the linear regression fit came from inversions of un-cleaned data sets. It is also important to note that the 2009 inversion showed the only positive deviations that we have ever seen.
Inverted Internal Sound Speeds Because of the strong radial decrease in the internal sound speed, the use of the squared deviations from Model S tends to overstate the magnitude of the sound speed changes at the outer mesh points. Therefore, we have interpolated the internal sound speed from Model S at each of the radial mesh points of our inversions and we have then used those interpolated values to convert the squared sound speed deviations directly into inverted sound speeds at each of those mesh points for each of the 23 observing intervals. One such example is shown at the right. At the scale of this plot, the profile of the inverted sound speed is indistinguishable from that in Model S.
Outlier Correction Procedure • Our initial attempt at performing a solar structural inversion on the table of fitted frequencies from the 2010 MDI spectra resulted in an unphysical oscillation in the radial sound speed profile in the radiative zone. • Because of this problem, we have developed a procedure to identify outlying frequencies and to replace them with re-fitted frequencies and with larger frequency uncertainties where necessary. • I will now describe the firstof the steps in this process before I will compare several of our inversion results from the cleaned tables with those from the raw tables.
Comparison of Inverted Squared Sound Speed Deviations from both Original (red) and cleaned (blue) Frequency Tables for One MDI Run
Comparison of raw and cleaned squared sound speed deviations for Second MDI Run
Comparison of HMI Raw and Cleaned Full-Disk Inversion Profiles from one Run
Demonstration that use of Non-n-Averaged Frequency Splitting Coefficients (red curve) Results in EvenLarger Deviations from Model S than When n-averaged Coefficients Are Used
Comparison of 5 Simultaneous MDI and HMI Medium-l Inversion Profiles
Overall Conclusions • Helioseismology has matured to the point where studies of solar cycle dependent changes in solar internal structure are now possible. • We have found very interesting departures from the standard solar thermodynamic structure in the outer half of the convection zone and in the subsurface shear layer shortly after the Cycle 23-24 Minimum.