Activity- Based Management
Learn how activity-based management enhances customer value and profit through ABC information, process value analysis, and cost reduction strategies.

Activity- Based Management
E N D
Presentation Transcript
Activity- Based Management Prepared by Douglas Cloud Pepperdine University
Objectives After studying this chapter, you should be able to: 1. Describe how activity-based management and activity-based costing differ. 2. Define process value analysis. 3. Describe activity-based financial performance measurement. 4. Discuss the implementation issues associated with an activity-based management system. Continued
Objectives 5. Explain how activity-based management is a form of responsibility accounting, and tell how it differs from financial-based responsibility accounting.
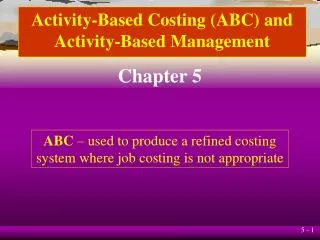
The Relationship of Activity-Based Costing and Activity-Based Management Activity-based management (ABM) is a systemwide, integrated approach that focuses management’s attention on activities with the objectives of improving customer value and the profit achieved by providing this value. ABC is the major source of information for activity-based management.
The Two-Dimensional Activity-Based Model Cost Dimension Resources Process Dimension Driver Analysis Activities Performance Measures How Well? Why? What? Cost Objects
Process Value Analysis Process value analysis is fundamental to activity-based responsibility accounting, focuses on accountability for activities rather than costs, and emphasizes the maximization of systemwide performance instead of individual performance. Process value analysis is concerned with: • (1) Driver analysis • (2) Activity analysis • (3) Performance measurement
Activity Analysis Activity analysis is the process of identifying, describing, and evaluating the activities an organization performs. Activity analysis should produce four outcomes: • What activities are performed. • How many people perform the activities. • The time and resources are required to perform the activities. • An assessment of the value of the activities to the organization.
Value-Added Activities Those activities necessary to remain in business are called value-added activities. Activities needed to comply with the reporting requirements, such as the SEC, are value-added by a mandate. Implicit in this definition is the notion that value-added activities may contain nonessential actions that create unnecessary cost.
Nonvalue-Added Activities All activities other than those essential to remain in business are referred to as nonvalue-added activities. These activities fail to produce a change in the product’s state or those activities that replicate work because it wasn’t done correctly the first time.
Scheduling • Moving • Waiting • Inspecting • Storing Nonvalue-Added Activities
Cost Reduction Through Activity Management 1. Activity elimination 2. Activity selection 3. Activity reduction 4. Activity sharing Activity Management Can Reduce Costs in Four Ways:
Efficiency Quality Time Assessing Activity Performance
Financial Measures of Activity Efficiency Financial measures of activity efficiency include: • Value- and nonvalue-added activity costs • Trends in activity costs • Kaizen standard setting • Benchmarking • Activity flexible budgeting • Activity capacity management
Formulas Value-added costs = SQ x SP Nonvalue-added costs = (AQ – SQ)SP Where SQ = The value-added output level of an activity SQ = The standard price per unit of activity output measure AQ = The actual quantity used of flexible resources or the practical activity capacity acquired for committed resources
Value- and Nonvalue-Added Cost Reporting Activity Activity Driver SQ AQ SP Purchasing Purchasing hours 20,000 23,000 $20 Molding Molding hours 30,000 34,000 12 Inspecting Inspection hours 0 6,000 15 Grinding Number of units 0 5,000 6 Value-added standards call for elimination
Value- and Nonvalue-Added Cost Reporting Activity Activity Driver SQ AQ SP Purchasing Purchasing hours 20,000 23,000 $20 Molding Molding hours 30,000 34,000 12 Inspecting Inspection hours 0 6,000 15 Grinding Number of units 0 5,000 6 Value-added standards call for elimination
Value- and Nonvalue-Added Cost Report for the Year Ended December 31, 2003 Activity Value-Added Costs Nonvalue-Added Costs Actual Costs Purchasing $400,000 $ 60,000 $460,000 Molding 360,000 48,000 408,000 Inspecting 0 90,000 90,000 Grinding 0 30,000 30,000 Total $760,000 $228,000 $988,000
Purchasing $ 60,000 $ 20,000 $ 40,000 Molding 48,000 35,000 13,000 Inspecting 90,000 30,000 60,000 Grinding 30,000 15,000 15,000 Total $228,000 $100,000 $128,000 Trend Report: Nonvalue-Added Costs Nonvalue-Added Costs Activity 2003 2004 Change
The Role of Kaizen Standards Kaizen costingis concerned withreducing the costs of existing products and processes. Controlling this cost reduction process is accomplished through the repetitive use of two major subcycles: • (1) the kaizen or continuous improvement cycle, and • (2) the maintenance cycle.
Check Check Act Act Search Establish Plan Lock in Kaizen Cost Reduction Process Do Do
Benchmarking uses best practices as the standard for evaluating activity performance. Benchmarking against internal operations is called internal benchmarking.
External Benchmarking Benchmarking that involves comparisons with others outside the organization is called external benchmarking. The three types of external benchmarking are: • Competitive benchmarking • Functional benchmarking • Generic benchmarking
Activity Flexible Budgeting Cost Formula Direct Labor Hours Fixed Variable 10,000 20,000 Direct materials --- $10 $100,000 $200,000 Direct labor --- 8 80,000 160,000 Maintenance $ 20,000 3 50,000 80,000 Machining 15,000 1 25,000 35,000 Inspections 120,000 --- 120,000 120,000 Setups 50,000 --- 50,000 50,000 Purchasing 220,000 --- 220,000 220,000 Total $425,000 $22 $645,000 $865,000
Activity Flexible Budgeting DRIVER: DIRECT LABOR HOURS Formula Level of Activity Fixed Variable 10,000 20,000 Direct materials $--- $10 $100,000 $200,000 Direct labor --- 8 80,000 160,000 Subtotal $--- $18 $180,000 $360,000 Continued
Activity Flexible Budgeting DRIVER: MACHINE HOURS Fixed Variable 8,000 16,000 Maintenance $20,000 $5.50 $64,000 $108,000 Machining 15,000 2.00 31,000 47,000 Subtotal $35,000 $7.50 $95,000 $155,000 Continued
Activity Flexible Budgeting DRIVER: NUMBER OF SETUPS Fixed Variable 25 30 Inspections $80,000 $2,100 $132,500 $143,000 Setups --- 1,800 45,000 54,000 Subtotal $80,000 $3,900 $177,500 $197,000 Continued
Activity Flexible Budgeting DRIVER: NUMBER OF ORDERS Fixed Variable 15,000 25,000 Purchasing $211,000 $1 $226,000$236,000 Total $678,500 $948,000
Activity Flexible Budgeting Budgeted Cost Activity Actual Cost 25 Setups Level Variance Inspection: Fixed $ 82,000 $ 80,000 $2,000 U Variable 43,500 52,500 9,000 F Total $125,500 $132,500 $7,000 F
Activity Capacity Management Activity capacity is the number of times an activity can be performed.
AQ = Activity capacity acquired (practical capacity) SQ = Activity capacity that should be used AU = Actual usage of the activity SP = Fixed activity rate Activity Capacity Management SP x AQ $2,000 x 60 $120,000 SP x AU $2000 x 40 $80,000 SP x SQ $2,000 x 0 $0 Unused Capacity Variance $40,000 F Volume Variance $120,000 U
Systems Planning Systems planning provides the justification for implementing ABM and address the following issues: 1. The purpose and objectives of the ABM system. 2. The organization’s current and desired competitive position. 3. The organization’s business processes and product mix. 4. The timeline, assigned responsibilities, and resources required for implementation. 5. The ability of the organization to implement, learn, and use new information.
Why ABM Implementations Fail • Lack of support of higher-level management. • Failure to maintain support from higher-level management. • Resistance to change. • Failure to integrate the new system.
Performance measures are established. Performance is measured. Rewards are provided based on performance. The Responsibility Accounting Model Responsibility is defined.
Responsibility Assignments Compared Financial-Based Responsibility Action-Based Responsibility 1. Organizational units 1. Proceeds 2. Local operating efficiency 2. Systemwide efficiency 3. Individual accountability 3. Team accountability 4. Financial outcomes 4. Financial outcomes
Performance Measures Compared Financial-Based Measures Activity-Based Measures 1. Organizational units budgets 1. Process-oriented standards 2. Standard costing 2. Value-added standards 3. Static standards 3. Dynamic standards 4. Currently attainable standards 4. Optimal standards
Performance Evaluation Compared Financial-Based Activity-Based Performance Evaluation Performance Evaluation 1. Financial efficiency 1. Time reductions 2. Controllable costs 2. Quality improvements 3. Actual versus standard 3. Cost reductions 4. Financial measures 4. Trend measurement
Rewards Compared Financial-Based Rewards Activity-Based Rewards 1. Financial performance basis 1. Multidimensional performance basis 2. Individual rewards 2. Group rewards 3. Salary increases 3. Salary increases 4. Promotions 4. Promotions 5. Bonuses and profit sharing 5. Bonuses, profit sharing, and gainsharing
End of Chapter