KHYBER PAKHTUNKHWA
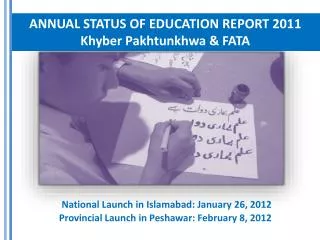
KHYBER PAKHTUNKHWA. Movement for making the invisible visible LEARNING at the Centre of SDG 4. ASER PAKISTAN 2010-2018. Citizen led large scale national household survey (3-16 years). Quality of education in rural and selected urban areas (5-16 years).

KHYBER PAKHTUNKHWA
E N D
Presentation Transcript
Movement for making the invisible visible LEARNING at the Centre of SDG 4 ASER PAKISTAN 2010-2018 • Citizen led large scale national household survey (3-16 years). • Quality of education in rural and selected urban areas (5-16 years). • Provides evidence on learning, access and equity. • Influence National & Provincial policy, plans and actions for Right To Education (RTE) Article 25-A, MDGs & SDG 4. • Influenced goal, target and indicator setting for SDG 4. • ASER tools mapped to lower primary competencies of grades 2-3 or SDG 4.1.1a; this indicator has been upgraded (Nov. 2018) by IAEG (inter-agency expert group) from tier III to tier II two classification
Testing basic competencies in Reading, Arithmetic, English and General Knowledge ASER ASSESMENT TOOLS • ASER Assessment tools cover: • Reading (Urdu/Pashto) • Arithmetic • English • General Knowledge Assessments are based on Class II level curriculum for English & Urdu/Sindhi/Pashto and Class III level for Arithmetic.
ASER 2018 casting footprint across KP 36 Rural Districts 1070 villages 21370 HHs 57349 children 1469 Schools
Proportion of enrolled children (3-5 years) has decreased (30%) as compared to 2016 (36%) Proportion of enrolled children (6-16 years) has increased (87%) as compared to 2016 (86%)
Gender gap has improved OUT-OF-SCHOOL CHILDREN (6-16 YEARS) GENDER GAP 2016 2018
Class wise enrollment of children –progressive decline from grades 3-10 CLASS WISE ENROLLMMENT
LEARNING LEVELS
PROVINCIAL COMPARISON- PUNJAB IN THE LEAD WITH AJK & ICT Province/Territory-wise map showing % children who can read story of class 2 level.
PROVINCIAL COMPARISON- PUNJAB IN THE LEAD WITH AJK, ICT & GB Province/Territory-wise maps showing % children who can read sentences of class 2 level.
PROVINCIAL COMPARISON- AJK, KP & GB IN THE LEAD Province/Territory-wise map showing % children who can do 2-digit division of class 3 level.
In literacy (Urdu/English) Children in private schools are performing better than government schools but Govt. Schools performing better in Arithmetic /Numeracy! LEARNING LEVELS BY SCHOOL TYPE – CLASS 5
Private tuition incidence reducing: greater among private school students CHIDLREN 5-16 YEARS TUITION TREND
Mothers with Primary Education has gone up (37%) as compared to 2016 (32%). COMPLETED ATLEAST PRIMARY EDUCATION PARENTAL EDUCATION 2018 2016
FACILITIES *- represents insufficient data **grants received till October 31, 2018
Multi-grade teaching more prevalent at Grade 2 level in Govt. schools: reverse in Middle schools MULTI GRADE TEACHING 2018 2016
INCLUSION: WHAT’S NEW IN THE TOOLS Inclusive Adaptation ASER Tools DISABILITY QUESTIONNAIRE -In 2018, the information on disability prevalence Punjab and Khyber Pakhtunkhwa, KP- Newly Merged Districts (FATA) and Islamabad-ICT using the Washington Group Survey on Disability Statistics- Short Set (6 Questions). - In 2018, Disability Prevalence pilot in 3000 HHs in Sindh(2) and Punjab (3) using Washington Group Survey on Disability Statistics-Child Functioning Module (5-16 Years)- 24 Questions ASER learning tools, for the first time, are being adapted in Pakistan Sign Language (PSL) and Braille in collaboration with Family Education Services Foundation (FESF) and Sightsavers. These have been adapted. Pilot completed in Punjab and Sindh (20 schools). Training is being conducted on adapted tools in Sindh and Punjab. Results of the Pilot will be shared in March, 2019 Technical Partners include : Sight savers; FESF; REAL Centre University of Cambridge; IDEAS; Department of Empowerment of Persons with Disabilities Sindh and Special Education Department Punjab
DISABILITY DATA DISAGGREGATED BY REGION 2018 Results- 119,400 Children 3-16 years 4 Regions-Variations • Key Findings: Mild-Moderate & Severe • Incidence Region & Gender: • -Regional Variations (2.72%- 8.1%) • Enrollment • Overall in Schools 72% -no differences between the proportion of children who are enrolled according to whether they were reported as having any difficulties or not • In, KP, children with moderate/severe difficulties are more likely to drop out than children with no difficulties Seeing, Hearing, Walking; Self Care; Understanding/Remembering Washington Group on Disability Statistics- Short Set (6). Qs to Primary Care Givers See Note pp.32-37
2.682% 1.437%
ASER IMPACT
ASER is a social movement on learning, equity and inclusion –a right to education tracking tool. • ASER’s quoted in: a) key government documents and sector analyses/ESPs/Policies and b) UNESCO: GEM Reports/UIS; Education Commission; WDR-WB, REAL Centre Cambridge Univ. etc. • ASER Findings in the Economic Survey of Pakistan (Ministry of Finance) up to 2015 in Education Chapter (10). • ASER and all citizen led assessments as PAL Network globally contributed to upgradation of SDG 4.1.1 a (lower primary) from Tier II to Tier II indicator in November 2018 (IAEG-Stockholm) . • ASER /ITA inputs to the Voluntary National Review (VNR) for High Level Political Forum (HLPF) 2019 alongwith partners • ASER tools assess learning outcomes –used by organizations/ practitioners Oxford Policy Management, SABAQ, The Citizens Foundation, ACTED and many more –adapted for lower primary government initiatives LND(Punjab) ASER a public good and a powerful reference and benchmarking document
ASER From Assessment to Action: informs and inspires accelerated, catch up, learning improvement and second chance program for out of school and in-school children at risk (ChaloParhoBarho-CPB), Adolescents/Youth Siyani Sahelian (Advancing Action for Adolescent Girls) and the Children’s Literature Festivals(CLF) • ASER data used in post graduate/ PhD research, university courses in Pakistan & abroad Teachers College Columbia University, Durham, Harvard & Cambridge Universities etc. • ASER mapped to Article 25A-and SDG 4 in Pakistan and performance of political parties across provinces; ASER to be tracked annually under Right to Education/25 A campaign • We Urge the New Government to : • fast track strategic actions for improved learning, reducing poverty and accelerating steps towards equity of learning outcomes for all groups especially the poorest and ALL Girls! • Address learning needs of children with disabilities and those enrolled in schools • Encourage, Govt. Autonomous and non-state bodies to have ASER data links on Websites –It is a public good with full access to reports, tools and raw data! ASER a public good and a powerful reference and benchmarking document
Mobilizing 10,000+ Volunteers – Citizens – Youth ! ASER PARTNERS • KhapalKhor Organization (KKO) • CMDO • Development Concerns • BAKAR • Organization for Legal & Social Service • SAWERA • CRDO • Kushboo Development Organization
GENDER DIFFERENCE MORE PRONOUNCED AT MIDDLE TO HIGHER SECONDARY LEVEL! The highest adjusted net primary enrolment ratio is observed in ICT (96%). This is followed by KP (87%) and Punjab (83%). Pakistan Education Statistics (2016-17). Girls continue to lag behind: Primary NER for Boys: 98% Girls:75% Middle to Higher NER for Boys: 65% Girls:32% More girls than boys continue to be out of school!
Effective Transition Rate also higher for boys than girls! Effective Transition Rate (ETR) between Primary and Lower Secondary Levels Effective Transition Rate (ETR) between Primary and Lower Secondary Levels for Sindh, Balochistan and KP-Newly Merged Districts is less than 80%. Pakistan Education Statistics (2016-17). Low transition rate leads to where a significant proportion of school age population is excluded from the education system at the very early stage of lower secondary level.
Gender Parity Index (GPI) for Enrolment Ratios in Primary & Secondary Education: 0.75 & 0.49 for KP respectively. It is below 1 for KP which signifies higher enrolment ratios for boys. Balochistan and KP-Newly Merged Districts show the worst condition of GPI for GER in primary as well secondary education. Pakistan Education Statistics (2016-17).
Survival Rate to Grade 5 for Girls in KP and KP- Newly Merged Districts stands at 57% and 26% respectively. Survival Rate also called Retention Rate, is the proportion of a cohort of pupils who reached Grade 5 expressed as a percentage of pupils enrolled in the first grade of a given cycle in a given school year. A Survival Rate approaching 100 percent indicates a high level of retention and low dropout incidence and vice versa.
INCOME INEQUALITIES as AS PER ASER RESULTS Disparities in enrollment: EQUITY in ASER 2018 Gender Disparities: Gap between the richest and the poorest by gender. In KP, 48% poorest girls are out of school compared to 27% richest girls not going to school. 20% enrolment gap between poorest girls and poorest boys!
Richest & Boys perform better in all three competencies- ASER 2018 INCOME INEQUALITIES- EQUITY
THANK YOU