Download
1 / 13
130 likes | 319 Vues
Exploring adaptation strategies for climate change in the Netherlands: a bio-economic farm level analysis. Plant Production Systems, Wageningen University, P.O. Box 430, 6700 AK Wageningen, The Netherlands * Corresponding author : Argyris Kanellopoulos ( argyris.kanellopoulos@wur.nl ).

E N D
Exploring adaptation strategies for climate change in the Netherlands: a bio-economic farm level analysis Plant Production Systems, Wageningen University, P.O. Box 430, 6700 AK Wageningen, The Netherlands * Corresponding author : Argyris Kanellopoulos (argyris.kanellopoulos@wur.nl) Argyris Kanellopoulos, Pytrik Reidsma, Joost Wolf, Maryia Mandryk, Ben Schaap and Martin Van Ittersum
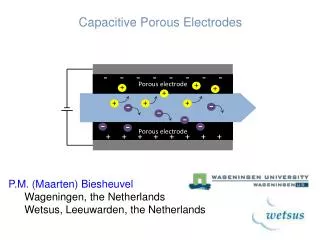
Introduction: study area • Study area = Flevoland (the Netherlands) • Modern arable and dairy systems • Mainly heavy, fertile clay soils • Assess consequences of a scenario towards 2050 assuming a strong temperature rise and a globalized economy (A1W) • Data from 75 individual arable farms (FADN 2000-2006)
Expected yield changes Based on WOFOST and survey
Methods: modeling framework 4 CAPRI • Outputs = 𝑓(inputs) • Economic , environmental indicators • Yield changes • Expected price changes 2 1 Scenarios FSSIM DEA 3 WOFOST
Farm System SIMulator (FSSIM) • Programming, constraint optimization model • Optimize objective function (e.g. gross margin) • Subject to a set of constraints: • Land constraint • Labour constraints • Capital constraint • Sugar beet quota constraint • ….
Setup of simulations • DEA: to calculate technical efficiency and identify best farm practices • FSSIM: to calculate economic-environmental indicators • Results of FSSIM for future scenarios are presented as relative changes from base year simulations.
Results: DEA and FSSIM (base year) • 64 out of 75 farms are currently technically efficient • Average efficiency score ≈ 98% • Model run P shows that 40% of the farmers are currently profit maximizers
Results: per farm type (economic size) Gross margin Capital Labour Land Crop protection Energy Fertilizers Yield change (Y) Full scenario (S)
Results: per farm type (economic size) Yields Areas Production Potatoes Sugar beet Wheat Vegetables Yield change (Y) Full scenario (S)
Discussion and Conclusions • Arable farms in Flevoland are in general technical efficient • In A1W 2050 scenario extra large farms tend to expand while smaller farms will shrink or stop • Production of vegetables and tulips increase! • Fertilizer application increases substantially in the A1W 2050 scenario • The effect of extreme events was not taken into account • Technological change (new genotypes, precision agriculture?) • FSSIM as a gross margin maximizing tool. Why not calibration?