Lab 2: Solar Cycle
Lab 2: Solar Cycle. AOS 101 Dis. 305. The Sun. It is a star at the center of the Solar System. About 109 times bigger than the Earth 75% of total mass is hydrogen and 25% helium It generates its energy by nuclear fusion of hydrogen nuclei into helium.

Lab 2: Solar Cycle
E N D
Presentation Transcript
Lab 2: Solar Cycle AOS 101 Dis. 305
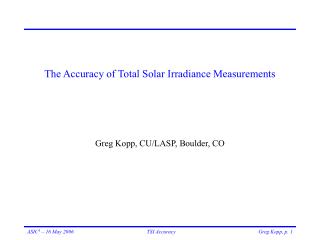
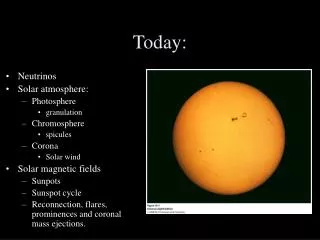
The Sun • It is a star at the center of the Solar System. • About 109 times bigger than the Earth • 75% of total mass is hydrogen and 25% helium • It generates its energy by nuclear fusion of hydrogen nuclei into helium. • Sun’s surface temperature: ~ 5500 deg C • The corona of the sun is expanding into space to form solar wind. http://en.wikipedia.org/wiki/File:Yohkohimage.gif
Sun and Earth’s climate • Why is the Sun important to us? • The Sun provides light and heat energy for photosynthesis to occur in order to support almost all life forms. • It also drives Earth’s climate and weather. • The amount of light from the Sun varies in time scales of milliseconds to billions of years. We want to understand how it affects climate on Earth when it changes and why it changes.
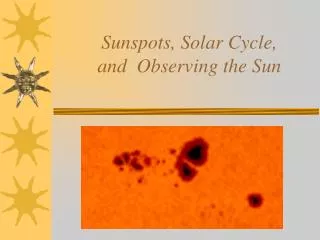
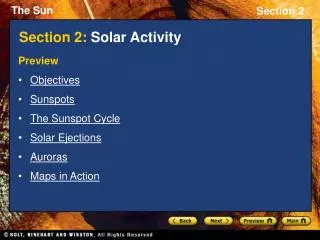
Observing the Sun / Sunspots • Don't stare directly at the Sun through a telescope or in any other way, unless you have the proper filters because it will damage your eyes ! • Pinhole Cameras / telescopes with solar filter are used to observe the Sun. • Or photograph the X rays coming from the Sun. • X rays can show the outer layer of the sun and the more complex magnetic fields. http://www.spaceweather.com/sunspots/doityourself.html
Observing the Sun / Sunspots This is taken with a Meade ETX 70AT beginner telescope and a scopetronics white light filter. http://astronomy.neatherd.org/Sunspots.htm
Sunspots • Sunspots are dark spots that are found on the surface of the Sun. • They has temperature of about 3700K, a lot colder than their surroundings (5700K). • Duration: several days to several weeks • Size: can be tens of thousands of km across http://astronomy.neatherd.org/Swedish%20sunspots1.jpg • They are caused by intense magnetic activity, which inhibits convection, forming areas of reduced surface temperature. • They expand and contract as they move across the surface of the sun.
Sun’s Tangled Magnetic Field • http://www.windows2universe.org/sun/activity/movies/sun_mag_field_rotate_tangle_big.mov • Differential rotation: Sun spins faster at the equator then the poles. • The magnetic field lines eventually get stretched at the equator, then it further get stretched to form today’s tangled field. • To learn more about the Sun: go to http://www.windows2universe.org/sun/sun.html
Solar Cycle, Magnetic Field, Sunspots • A process which the Sun’s magnetic poles flip. • It usually happens at the peak of the sunspot cycle. • http://www.windows2universe.org/sun/movies/sunspots_subsurface_mag_field_gsfc_big.mov http://www.windows2universe.org/sun/atmosphere/sunspot_form_jpg_image.html
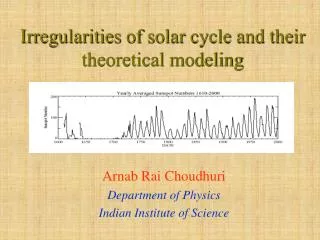
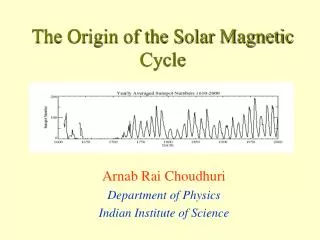
Solar Cycle • Sunspots on the Sun increases from 0 to over 100, then back to near 0 in one cycle. • Lab homework: to figure out how long is one solar cycle. • The total solar irradiance (TSI)(the amount of solar radiative energy incident on the Earth’s upper atmosphere) has changed by about 0.1% during recent sunspots cycle. • This variation of 0.1% is about global tropospheric temperature change of 0.5-1.0 deg C. • Lab homework: to analyze TSI and sunspots data in determining their relationship to one another • We still do not know about the nature and causes of the cycle in details. • There is no model that we could rely on in predicting the future sunspot numbers.
The SORCE mission • As part of the Solar Radiation and Climate Experiment (SORCE), which is sponsored by NASA, is to measure the total solar irradiance. • Mission goal: try to understand long term climate change and natural variability of the Sun for better climate prediction. • Launched date: January 2003 • Dataset which we’ll be using: Total Solar Irradiance (TSI) • http://lasp.colorado.edu/sorce/data/tsi_data.htm#plots
Lab write up • Introduction : what is the lab about? Objectives? • Data: describe the data and where it came from • Data Analysis: what you did to the data and what results you got? • figures • Summary: what did you learn?
Microsoft Excel • Functions – max,min,average,etc • Type in =MAX(A1:A10) -to find the maximum number through column A row 1 to column A row 10 You can find the average by the function AVERAGE To find more functions, go to “Insert” on the top bar, and then look for “function”