Download
1 / 14
160 likes | 392 Vues
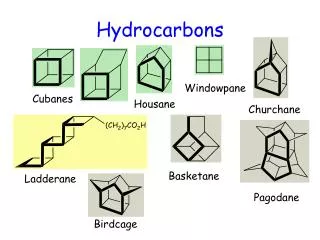
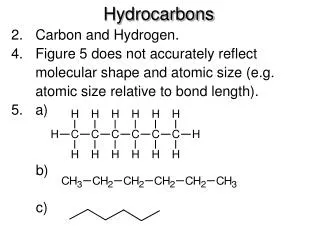
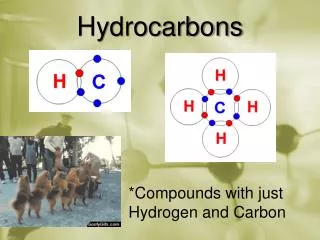
Property Scaling Relations for Nonpolar Hydrocarbons. Sai R. Panuganti 1 , Francisco M. Vargas 1, 2 , Walter G. Chapman 1 1 Chemical and Biomolecular Engineering Department, Rice University, Houston, USA 2 Department of Chemical Engineering, The Petroleum Institute, Abu Dhabi, UAE.

E N D
Property Scaling Relations for Nonpolar Hydrocarbons Sai R. Panuganti1, Francisco M. Vargas1, 2, Walter G. Chapman1 1 Chemical and Biomolecular Engineering Department, Rice University, Houston, USA 2 Department of Chemical Engineering, The Petroleum Institute, Abu Dhabi, UAE February, 2013
Outline • One-Third Rule • Electronic polarizability • Dielectric constant • Critical temperature and pressure • Surface tension • Conclusion
One-Third Rule • Specific Refractivity: independent of the temperature and pressure n, refractive index and ρ, mass density (g/cc) • For nonpolar hydrocarbons and their mixtures Constant True volume of the molecules in unit volume True density of the molecules • But strictly speaking, it is a function of the mass density and can be expressed as L-L Expansion
One-Third Rule Increase Temperature Volume occupied by molecules without considering space between molecules Vincreases, ρ decreases n increases For nonpolar hydrocarbons Vargas FM, Chapman WG; Fluid Phase Equilibria, 2010; 290:103-108
Electronic Polarizability • Lorentz–Lorenz equation: • where, N – Number of molecules per unit volume • α – Polarizability • Refractive index and Polarizability are independent of the amount of material • where, Na – Avogadro number • v – Molar Volume (v = MW/ρ) • With the help of One-Third Rule the above expression simplifies as • The above equation is independent of the state of the substance and its polarizability can be computed by just knowing the molecular weight
Predicted Polarizability • Using One-Third Rule • Average absolute deviation is 4.16 % • Using Lorentz-Lorenz Expansion • Average absolute deviation is 2.72 % • Data shown is for 80 different nonpolar • hydrocarbons belonging to different homologues series
Dielectric Constant • It is well established that for weakly magnetic materials • εr , relative permitivity • For low-loss materials like nonpolar hydrocarbons, • k, dielectric constant • Substituting dielectric constant in the One-Third Rule and solving for dielectric constant • The dielectric constant expression can handle operational variations in temperature and pressure • It is independent of the knowledge of individual constituents of amixture or the composition allowing the use for complex fluids such as crude oils and polydisperse polymers
Predicted Dielectric Constant • Using One-Third Rule • Average absolute deviation is 1.98 % • Using Lorentz-Lorenz Expansion • Average absolute deviation is 1.0 % • Data shown is for 260 nonpolar hydrocarbons, including polymers, mixtures with varying temperatures and pressures Panuganti SR, Vargas FM, Chapman WG; IEEE Transactions on Dielectrics and Electrical Insulation, 2013; Submitted
Critical Temperature and Pressure • From literature we have, • Thus, the following expression holds good • Applying One-Third Rule • also Hildebrand and Scott Buckley et al. Let, Hildebrand JH, Scott RL; The Solubility of Nonelectrolytes, 1950 Buckley et al; Petroleum Science and Technology, 1998; 16:251-285
Critical Temperature and Pressure Panuganti SR, Vargas FM, Chapman WG; Industrial and Engineering Chemistry Research, 2013; Accepted
Predicting Critical Properties Average absolute deviation is 2.2 % Average absolute deviation is 4.5 % • Data shown is for 80 different nonpolar • hydrocarbons belonging to different homologues series. The applicability to mixtures is limited to nonpolar hydrocarbons composed of similar sized molecules
Surface Tension from Hole Theory • Volume of hole = Volume of liquid - Volume of solid • Heat of fusion = Energy required for the formation of all the holes • Solving the Schrodinger wave equation for a hole in a liquid, • Using the correlation of a/v2 from the previous section, at a given temperature we have • For example at 20oC we have where, Auluck FC, Rai RN; Journal of Chemical Physics, 1944; 12:321-322 Furth R; Proc. Phys. Soc., 1940; 52:768-769
Predicted Surface Tension • The practical application of equation can improved further by incorporating the temperature variation of surface tension • With reference temperature as 20°C, surface tension at any other temperature can be calculated as The parameter of critical temperature can be eliminated using the equation obtained in the critical properties section. Average absolute deviation is 1.8 %
Conclusion • Polarizability of an asphaltene molecule of molecular weight 750 g/mol will be 99.16x10⁻²⁴ cc • Polydispere asphaltene system with density between 1.1 to 1.2 g/cc at ambient conditions will have a dielectric constant between 2.737 and 3 Panuganti SR, Vargas FM, Chapman WG; IEEE Transactions on Dielectrics and Electrical Insulation, 2013; Submitted Panuganti SR, Vargas FM, Chapman WG; Industrial and Engineering Chemistry Research, 2013; Accepted