Download
1 / 20
200 likes | 1.05k Vues
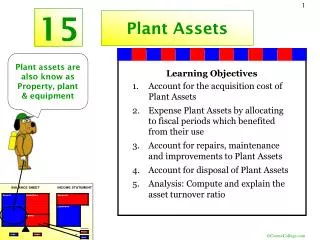
MEASURING THE DEPRECIATION OF PLANT ASSETS. Depreciation is the allocation of a plant asset’s cost to expense over the period the asset is used The matching principle matches an asset’s expense against the revenue generated over the asset’s life. Estimated useful life, 20 years.

E N D
MEASURING THE DEPRECIATION OF PLANT ASSETS • Depreciation is the allocation of a plant asset’s cost to expense over the period the asset is used • The matching principle matches an asset’s expense against the revenue generated over the asset’s life
Estimated useful life, 20 years $32 million cost Depreciation and the Matching of Expense with Revenue Annual revenue generated, $9 million minus Annual depreciation expense, $1.6 million* *$32 million/20 yrs. = $1.6 million per year
MEASURING THE DEPRECIATION OF PLANT ASSETS • Depreciation • Is nota process of valuation • Does not mean that the business sets aside cash to replace assets as they wear out • Accumulated depreciation does not represent a growing amount of cash
MEASURING THE DEPRECIATION OF PLANT ASSETS • The causes of depreciation are • Physical wear and tear • Obsolescence • An asset is obsolete when another asset can do the job better or more efficiently
MEASURING THE DEPRECIATION OF PLANT ASSETS • To measure depreciation for an asset one must know the • Cost • Estimated useful life • The length of service the business expects to get from the asset--an estimate of how long an asset will be useful • Useful life may be expressed in years, units of output, miles, or another measure
MEASURING THE DEPRECIATION OF PLANT ASSETS • Estimated residual value (scrap value) • The expected cash value of an asset at the end of its useful life • Estimated residual value is not depreciated because the business expects to receive this amount from disposing of the asset
MEASURING THE DEPRECIATION OF PLANT ASSETS A plant asset’s depreciable cost: Depreciable cost = Asset’s cost - Estimated residual value
MEASURING THE DEPRECIATION OF PLANT ASSETS • We will look at two methods for computing depreciation • Straight line • Declining-balance
MEASURING THE DEPRECIATION OF PLANT ASSETS The following data will be used to illustrate depreciation computations of a Home Depot truck with the two methods. Cost of truck $41,000 Less: Estimated residual value (1,000) Depreciable cost $40,000 Estimated useful life : Years 5 years
MEASURING THE DEPRECIATION OF PLANT ASSETS Straight-line Method Straight-line depreciation per year Cost - Residual value = Useful life, in years = $41,000 - $1,000 5 = $8,000 An equal amount of depreciation is assigned to each year of asset use
MEASURING THE DEPRECIATION OF PLANT ASSETS The entry to record depreciation is DR CR Depreciation expense - Truck 8,000 Accumulated depreciation - Truck 8,000
MEASURING THE DEPRECIATION OF PLANT ASSETS • Assume that the truck was purchased on January 1, 2001, and that Home Depot’s fiscal year ends on December 31 • A straight-line depreciation schedule is presented on the next slide • The final column shows the asset’s book value, the asset’s cost less accumulated depreciation
Straight-Line Depreciation Schedule for the Home Depot Truck Depreciation for the Year Asset Book Value Accumulated Depreciation Date Asset Cost Depreciation Expense 1- 1-2001 $41,000 $41,000 12-31-2001 $8,000 $ 8,000 33,000 12-31-2002 8,000 16,000 25,000 12-31-2003 8,000 24,000 17,000 12-31-2004 8,000 32,000 9,000 12-31-2005 8,000 40,000 1,000
MEASURING THE DEPRECIATION OF PLANT ASSETS • Is an accelerated depreciation method • A method that writes off a relatively larger amount of the asset’s cost nearer the start of its useful life than the straight-line method • Computes annual depreciation by multiplying the asset’s book value by a constant percentage Declining-Balance (DB) Method
In the DB depreciation schedule, the fifth and final year’s depreciation is $4,314 (the $5,314 book value less $1,000 residual value): Depreciation for the Year Asset Book Value Asset Book Value Asset Cost DB Rate Depreciation Expense Accumulated Depreciation Date 1- 1- 2001 $41,000 $41,000 12-31-2001 0.40 x $41,000 = $16,400 $16,400 24,600 12-31-2002 0.40 x 24,600 = 9,840 26,240 14,760 12-31-2003 0.40 x 14,760 = 5,904 32,144 8,856 12-31-2004 0.40 x 8,856 = 3,542 35,686 5,314 12-31-2005 4,314* 40,000 1,000 *Last-year depreciation is the amount needed to reduce asset book value to the residual value ($5,314 - $1,000 = $4,314).
MEASURING THE DEPRECIATION OF PLANT ASSETS • The DB method differs from other methods in two ways: • The asset’s residual value is ignored initially; in the first year depreciation is computed on the asset’s full cost • Depreciation expense in the final year is whatever amount is needed to reduce the asset’s book value to its residual value
Comparing the Depreciation Methods Straight-Line Declining-Balance Year 1 $ 8,000 $16,400 2 8,000 9,840 3 8,000 5,904 4 8,000 3,542 5 8,000 4,314 Total $40,000 $40,000
MEASURING THE DEPRECIATION OF PLANT ASSETS • The straight-line method best meets the matching principle for a plant asset that generates revenue evenly over time • The Declining Balance method (DB) applies best to those assets that generate greater revenue earlier in their useful lives
Straight-Line Declining Balance $ of Annual Depreciation $ of Annual Depreciation 1 2 3 4 5 1 2 3 4 5 Time, in years Time, in years Depreciation Patterns Through Time
Use of the Depreciation Methods by 600 Companies *Most of these are probably declining-balance methods because depreciation for income tax purposes is based on the declining-balance concept. Some companies use the same depreciation method for financial statement purposes and for tax purposes.