Standardized Mortality Ratio (SMR) Project
Standardized Mortality Ratio (SMR) Project. Lisle Mukai, QI Coordinator ESRD Network 18 December 2, 2009. Standardized Mortality Ratio (SMR) .

Standardized Mortality Ratio (SMR) Project
E N D
Presentation Transcript
Standardized Mortality Ratio (SMR) Project Lisle Mukai, QI Coordinator ESRD Network 18 December 2, 2009
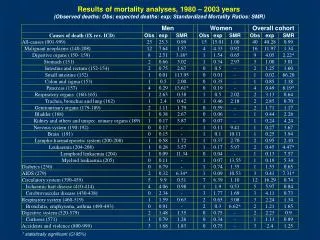
Standardized Mortality Ratio (SMR) • The SMR compares the observed death rate in your facility to the death rate that was expected based on national death rates for patients with the same characteristics as those in your facility (Wolfe, 1992). • The SMR indicates whether patients treated in the facility had higher or lower mortality than expected when adjusted for age, race, ethnicity, sex, diabetes, years of ESRD, co-morbidities, body mass index, and population death rates.
Standardized Mortality Ratio (SMR) • The facility’s Standardized Mortality Ratio (SMR) is found in the Dialysis Facility Reports (DFR) and available on the Dialysis Facility Compare website. • These reports are prepared by the University of Michigan Kidney Epidemiology and Cost Center (UM-KECC) for each dialysis facility under contract with the Centers for Medicare & Medicaid Services (CMS). • Distributed by the Networks
Standardized Mortality Ratio (SMR) Project • According to the 2009 DFR reports there are 11 facilities within Network 18 that were ranked “Worse Than Expected”. • During this project, facilities will be required to conduct a Root Cause Analysis for their high SMR and develop a QAPI plan to address the facility’s findings. The facility will implement the plan and monitor their progress for improvement.
Standardized Mortality Ratio (SMR) Project • Inclusion Criteria: • Facilities with an SMR rated “Worse Than Expected” • Objective: • All facilities will be required to develop a QAPI (Quality Assessment and Performance Improvement) Plan utilizing the PDSA model to improve their SMR and implement those plans. • Successful completion of the facility’s plan will be based on the development of a process, Policy & Procedure, or program to address identified area(s) for improvement.
SMR Project (continued) • Goal: Each facility will conduct a QAPI to address their SMR based on their identified issue(s) and develop a process, Policy & Procedure, or program and implement those processes. • Timeline: • September 2009 – May 2010 • Project facilities will be monitored for three years (2009-2012)
SMR Project (continued) • Due dates: • Facility Process Review Checklist – dueOctober 13, 2009 • Facility Manager Acknowledgement Letter – due October 13, 2009 • Facility Medical Director Acknowledgment Letter • QAPI (Quality Assessment and Performance Improvement) Plan– due Wednesday, December 31, 2009
SMR Project (continued) • Network Responsibilities: • Project Leader • Instruct/assist with the QI process • Distribute templates for RCA and PDSA • Distribute resources and evaluate their usefulness • Provide technical assistance as necessary • Conduct facility site visits as necessary
SMR Project (continued) Facility Responsibility: • Conduct a root-cause analysis and develop a QAPI Plan • Submit a copy of your QAPI plan to the Network • Implement QAPI plan and revise as necessary during the project • Monitor your facility’s progress towards achieving the goal
SMR Project (continued) • Identify tools that would be useful for your facility • Follow project timelines/due dates • Submitting requested documents for the project in a timely manner • Develop a process or Policy & Procedure or to address identified issue(s) • Submit a copy to the Network
Quality Assessment and Performance Improvement Plan (QAPI) 494.110: (V626) Condition The dialysis facility must develop, implement, maintain and evaluate an effective, data driven, quality assessment and performance improvement program with participation by the professional members of the interdisciplinary team.
Quality Assessment and Performance Improvement Plan (QAPI) • Interdisciplinary Team: (minimum) • Physician • Registered nurse • Social Worker • Dietitian
Quality Assessment and Performance Improvement Plan (QAPI) (continued) Standard: Program Scope: 1. The program must include, but not limited to, an ongoing program that achieves measurable improvement in healthcare outcomes and reduction of medical errors by using indicators or performance measures associated with improved health outcomes and with the identification and reduction of medical errors.
Quality Assessment and Performance Improvement Plan (QAPI) (continued) Standard: Program Scope: 2. The dialysis facility must measure, analyze, and track quality indicators or other aspects of performance that the facility adopts or develops that reflect processes of care and facility operations.
Quality Assessment and Performance Improvement Plan (QAPI)(continued) Standard: Monitoring performance improvement: The dialysis facility must continuously monitor its performance, take actions that result in performance improvements, and track performance to ensure that improvements are sustained over time.
Quality Improvement Process The process involves: • Defining the problem • Investigating through gathering evidence • Identifying root causes • Implementing solutions • Monitoring those solutions to ensure they continue to prevent the original problem. Rootcauseanalybasics.com
Quality Improvement Process (continued) Root Cause Analysis (RCA): At its most basic, the process asks three questions, which together provide the framework of a root cause analysis investigation: 1. What was the problem? 2. What were the causes of the problem? 3. What actions should be taken to prevent the problem from occurring again? Rootcauseanalybasics.com
Quality Improvement Process (continued) • Root cause analysis can use a variety of techniques to uncover root causes, including cause mapping, change analysis, the Ishikawa fishbone diagram, 5 Whys, and others. • All are designed to analyze the elements affecting a particular outcome to determine the root causes. Rootcauseanalybasics.com
Quality Improvement Process (continued) Root Cause Analysis Investigations: • Every cause uncovered by RCA must be backed up by evidence. • RCA usually uncovers a system of root causes. • RCA uncovers specific causes and effects. • RCA results in executable, quantifiable solutions that may be monitored. Rootcauseanalybasics.com
Quality Improvement Process (continued) Root Cause Analysis Investigations: (continued) • RCA does not point blame at any one person or group, but simply identifies a system of causes and effects that lead to and incident. • RCA focuses on past events. Rootcauseanalybasics.com
Quality Improvement Process(continued) Fishbone Diagram (aka: Cause and Effect Diagram) • The fishbone diagram will help to visually display the many potential causes for a specific problem or effect.
Quality Improvement Process (continued) Fishbone Diagram (continued) • The Cause-and-Effect diagram can be used by individuals or teams - most effective by a group. • The team assists by making suggestions of possible causes until no more causes can be suggested. • Once the entire fishbone is complete, a team discussion takes place to decide what are the most likely root causes of the problem.
Quality Improvement Process (continued) Fishbone Diagram: (continued) • Benefits of a fishbone diagram: • It helps teams understand that there are many causes that contribute to an effect. • It graphically displays the relationship of the causes to the effect and to each other. • It helps to identify areas for improvement. Institute for Healthcare Improvement
Quality Improvement Process (continued) 5 Whys: Repeatedly asking the question “Why” to peel away the layers of symptoms which can lead to the root cause of a problem. • Although this technique is called "5 Whys," you may find that you will need to ask the question fewer or more times than five before you find the issue related to a problem. Six Sigma (www.isixsigma.com)
Quality Improvement Process (continued) Benefits Of The 5 Whys • Help identify root cause of a problem. • Determine the relationship between different root causes of a problem. • One of the simplest tools; easy to complete without statistical analysis. Six Sigma (www.isixsigma.com)
Quality Improvement Process (continued) Whys And The Fishbone Diagram • The 5 Whys can be used individually or as a part of the fishbone diagram. • The fishbone diagram helps you explore all potential or real causes that result in a single defect or failure. • Once all inputs are established on the fishbone, you can use the 5 Whys technique to drill down to the root causes. Six Sigma (www.isixsigma.com)
Whys And The Fishbone Diagram Six Sigma (www.isixsigma.com)
Quality Improvement Process: (continued) Plan-Do-Study-Act: PDSA is the format the Network uses for developing a QAPI plan. ACT PLAN STUDY DO
Quality Improvement Process:(continued) • Quality improvement is a continuous cycle of planning, implementing strategies, evaluating the effectiveness of these strategies and reflection to see what further improvements can be made. Royal Children’s Hospital Melbourne – Clinical Quality & Safety
Quality Improvement Process:(continued) • PDSA approaches promote action by getting clinicians to reflect and brainstorm strategies that they hope will lead to improvement. • It also promotes evaluation of these changes once the strategies have been implemented. Royal Children’s Hospital Melbourne – Clinical Quality & Safety
Quality Improvement Process:(continued) • PDSA is a cycle of improvement that involves asking three key questions: 1. What are we trying to accomplish? 2. How will we know that a change is an improvement? 3. What changes can we make that will result in an improvement? NHS Scotland (www.clinicalgovernance.scot.nhs.uk
Quality Improvement Process:(continued) • Plan: • Set your objective for the project • Set goals to achieve (numerical goals and a target date) • Develop your plan on how you will improve your identified problem • Include a plan for collecting data • List data sources you will use to monitor your progress for the project
Quality Improvement Process:(continued) Plan (continued): • Write out the measure you will be using to analyze if you are achieving your goal. (numerical formula) Example: # of prevalent patients using AVF as primary access = AVF rate Total # of patients at the facility
Quality Improvement Process:(continued) Plan (continued): • Note the frequency in which you will conduct measurement of your progress • Note your baseline for comparison towards your goal
Quality Improvement Process:(continued) Do: • Implement your plan • Document problems and unexpected observations of your plan Study: • Analyze the results and compare it to the goal • This analysis should be conducted with the interdisciplinary team.
Quality Improvement Process:(continued) Act: • Is your plan successful? • How will you ensure continued improvement? • If it wasn’t successful, what needs to be changed based on what you have learned? • Should you continue to search for other root causes?
Plan-Do-Study-Act (PDSA) (continued) • The PDSA cycle is a continuous cycle. It allows you to frequently assess your plan and make revisions as necessary to achieve your goal. • Your plan should be reviewed at least monthly and/or when you realize that your strategy or activity is not working.
Quality Improvement Process:(continued) • Note your progress on your form so that you have a record of the strategies/activities you’ve attempted and results of those attempts as well as the revisions you have made to improve your plan.
Barriers to Facility Improvement Related to SMR • Accuracy Issues (based on Medicare Billing data and may not capture 100% of patient population) • DFR includes deaths up to 60 days after transfer out from the facility • SMR calculation depends on the accurate completeness of the form by facility staff (results can be a mismatch between 2728 initial data and DFR billing data) UM-KECC
Common Barriers and Issues Identified by Network 18 Facilities in the Past: • High infection rate due to high catheter rate • Medical Insurance Issues (Emergency medical only) • Under-reporting of co-morbidities on the 2728 CMS Medical Evidence Forms • Under-reporting of the number of patients with diabetes as a primary cause of ESRD
Variables That May Affect SMR • Unique variables: • Geographic location • Patient population characteristics • Small facility size • Admission of more acutely ill vs. stable patients • Other factors • Clinical Indicators • Adequacy of dialysis • Hemoglobin • AVF utilization • Serum Albumin
Facility Process Review Checklist • Facility Results: NOT MET or IMPLEMENTED • At least 92% of patients in the facility have a Kt/V > 1.2 or at least 89% of patients in the facility have a URR > 65% • Less than <10% of patients in the facility have a catheter as a permanent vascular access. • At least 50% of patients in the facility have an AVF as a permanent vascular access. • Facility has a formal vascular access monitoring/ surveillance program
Network 18 Clinical Indictor Goals Adequacy: • % of Pts with mean URR > 65% = 89% • % of Pts with mean spKt/V > 1.2 = 92% • % of Pts with mean weekly Kt/V > 1.7 (PD) = 80% (CMS goal) Anemia: • % of Pts with mean Hgb 10-12 g/dL = 52% • % of Pts with mean Hgb < 10 = < 4%
Network 18 Clinical Indictor Goals Nutrition: • HD = % of Pts with mean serum Albumin > 3.5/3.2 g/dL (BCG/BCP) = 85% • PD = % of Pts with serum Albumin > 3.5/3.2 g/dL (BCG/BCP) = 65% Vascular Access: (CMS AVF Goal = 66%) • % of Pts with Prevalent AVF = 57.8% (by March 31, 2010) • % of Pts with Catheter > 90 days = < 10% • % of Pts with AVGs = < 24%