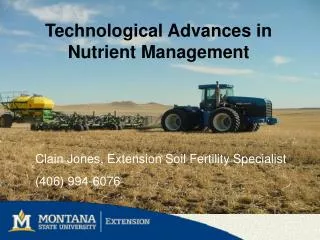
Technological Advances in Nutrient Management
Technological Advances in Nutrient Management. Clain Jones, Extension Soil Fertility Specialist (406) 994-6076. What can new technologies do for the producer?. New technologies can: Assess soil nutrient variability Increase the possibility of higher yields and quality

Technological Advances in Nutrient Management
E N D
Presentation Transcript
Technological Advances in Nutrient Management Clain Jones, Extension Soil Fertility Specialist (406) 994-6076
What can new technologies do for the producer? • New technologies can: • Assess soil nutrient variability • Increase the possibility of higher yields and quality • Identify areas of potential nutrient leaching, runoff or loss • Save money in the long term through reduced inputs and/or increased yields and quality
Some Basics • New technologies are becoming less expensive and more user-friendly. • They are becoming more accessible with greater technical support and information available for the specific system. • There are advantages and limitations to each type of technology. • The appropriateness of each technology for your operation needs to be considered. • Systems can be mixed with your existing equipment to fit your goals, budgets and needs.
Geographic Information Systems (GIS) • Computer software that stores, analyzes and displays spatial data and its corresponding attributes • Attributes include: soil type, pH, salinity levels, nutrient levels, and crop history • GIS can overlay multiple data maps • GIS can store, calculate, and model current and historical data • Maps are the main visual output but can include reports, tables and charts
GIS Example Data layer of yield Data layer of topography from a Digital Elevation Model (DEM) Data layer of soil conductivity Output: A visual display of areas of low yield and high EC, indicating possible salinity problems OR fertility differences
GIS Uses and Limitations • Example: GIS can be used to predict fertilizer needs across a field • Limitations: • Cost of the software package • Understanding the software • Resources: • Books, Internet classes on GIS • Consultants and MSU faculty/staff specializing in GIS
Global Positioning Systems (GPS) An instrument that receives satellite signals to calculate your position (latitude, longitude and elevation). (Morgan and Ess, 1997)
Signal Availability and Accuracy Availability: GPS units need 4 or more signals to accurately pinpoint your location (“Trilateration”). Signal loss can occur with atmospheric conditions, excessive electromagnetic radiation (e.g. a microwave transmitting tower), etc. Differential GPS (DGPS) – corrects signalsDGPS – accurate within 1 yard Uncorrected GPS - accurate to within 10 yards. It’s important to recognize uncorrected GPS from DGPS Uncorrected GPS accuracy has greatly improved in the last few years.
Satellite Signals Serve Multiple Applications While this diagram shows only 1 satellite, 4 or more are needed for accurate positioning. (Morgan and Ess, 1997)
Multi-antenna GPS receiver Mount arms with a GPS antenna Toolbar (row units Steering Axle not shown) Steering Axle GPS Applications • Units mounted on vehicles for tracking and guidance: eliminates overlaps and uneven application of inputs • Hand held units enable data recording at exact points (soil sampling) • GPS in conjunction with other technologies (GIS) Figure from Lessiter, Farm Equip. Aug/Sept 2006
Auto Guidance Systems using GPS First Generation: GPS-based navigation technology using lightbars. Mounted at front of a tractor's cab to show how straight the tractor is traveling. Cost range: $1,800 - $4,000 Second Generation: Auto Guidance/Auto Steer – GPS unit relays satellite signals to electronically steer the equipment Has 4” accuracy, guided by DGPS Cost range: $10-15K Third Generation: Real Time Kinematic Guidance system (RTK) Has 1” accuracy Costs apprx. $40 K General benefits of Auto Steer: Increases accuracy of seeding, fertilizing and harvesting, reduces time in the field, and decreases driver fatigue
Are auto guidance systems worth the cost? A 2004 Purdue study of the 3 guidance systems used in a corn/soybean rotation farm, concluded that: For a 1,800 ac farm not planning on expanding their acreage – Light bar technologywas most cost effective reducing time in the tractor by 11%. For a farmer wanting to expand to 2,400 ac -4” accuracy autoguidance was most cost effective, reducing tractor time by 6%. For a farmer who needed high accuracy i.e.) using strip till methods - 1” RTK technology was most cost effective. (Leer. S and Lowenberg-DeBoer J. 2004) http://news.uns.purdue.edu/html4ever/2004/040413.Lowenberg.gps.html
Remote Sensing (RS) Collects data from reflected electromagnetic energy and converts it into images using satellites or airplanes. Any data that is suspect or highly irregular, needs to be confirmed by field investigation. (Morgan and Ess, 1997)
Electromagnetic Energy Used in Remote Sensing Plants reflect red to infra red. Airplanes or satellites record this energy to create images.
Example of Remote Sensing Imagery A Montana study identified no-till fields with RS imagery with 95% accuracy. Selected till treatments (bold white lines) and no-till fields (dashed). Bricklemeyer et al., 2002
Remote Sensing Applications Use of Vegetation Indices • Assesses plant leaf area, organic matter, plant stress and canopy biomass • Different shades and colors are used to indicate different crops/nutrient levels • Normalized Difference Vegetation Index (NDVI) compares the ratio of infra-red and red light to determine biomass • A 9 year study of wheat and barley in MT found vegetation indices useful in estimating regional or farm scale yield but less effective in predicting yield early in the season (Lubus et al., 2002).
Remote Sensing Limitations NDVI values correspond to live biomass (a), but are unable to indicate % N in live biomass (b) in one Montana study (Thoma, 1998). RS is often not able to accurately predict nutrient content inplant tissue
Remote Sensing Limitations Application of RS to nutrient management has been slow due to: • Expense • Lengthy time to receive data • Inadequate repeat coverage • Cloud coverage hampers RS collection • Uncertainty in data analysis when determining nutrient levels • A number of different factors affect the analysis of the imagery: Nitrogen, potassium, water stress, disease, etc.
In-Field Sensors • Chlorophyll Meters • Can indicate plant tissue N and topdress need • Meters should be calibrated to a crop section with known N levels, then compared to the crop in question • Important limitation: changes in chlorophyll can be caused by several factors • Electrical Conductivity (EC) Meters • Measure the electrical current from anion (nitrate-N) and cation (K+, Mg2+) flow through the soil • Soil texture highly influences this flow • EC meters infer nutrients in solution and are helpful when used in conjunction with other technologies • Soil Moisture Sensors • Soil moisture content is related to soil texture, nutrient transport, potential salt impacts, all of which affect soil productivity
Yield Monitoring and Mapping Yield monitors are attached to conveyors or combines to measure grain yield and moisture content. (adapted from Lotz, 1997) Yield Map of Corn showing field variation: Light grey <80 bu/A, low yield Medium grey 160 bu/A, avr. Yield Dark grey >200bu/A, high yield. Letters:A) corn hybrid change, B) surface drainage problems, C) low wet area, D) old woodlot recently cleared, E) end row compaction, F) change in soil type, G) a mechanical problem, and H) grass waterway. Grisso et al.,2003
Benefits of yield monitoring and mapping • Identifies in-field variations in yield • Allows fine tuning of next year’s seeding and fertilizer applications • Overall yield monitor accuracy is improving with use and research, while in-field accuracy is improved with calibration Limitations: • Re-calibration is needed when plot conditions change ie) grain moisture, temperature or test weight • Correlating yield maps to nutrient levels is time-consuming
Variable Rate Technology Varying the application rates of seed, fertilizer or pesticides to adjust for in-field differences • Historically, intensive soil sampling had been necessary to measure and adjust for this variation. • Now, modern technologies can complement and enhance soils data.
Map based VRT systems How does it work? • Assess application needs by using maps of yield goals and field characteristics • Uses a GPS unit and a database to read the yield map and apply nutrients according to that map Benefits • Rates are determined prior to application • Any concerns about rates can be addressed before applying Limitations • Nutrient levels change over time; maps do not reflect these changes • Often a limited number of samples are taken: a source of error • Need a GPS and GIS system to build and track data
Sensor based VRT systems • How does it work? • Sensors attached to equipment to test in-field nutrient variability and apply nutrients according to current conditions Benefits • Rates of applied nutrients may be more accurate as they reflect what is currently needed • Does not need a GPS and GIS Limitations • Cannot store past data or field maps to fine tune application rates • Sensors need to be calibrated with crop response Profitability of VRT or site specific applications depends on many factors: soil moisture, market conditions, and application costs.
Current Research in Precision AG • Research at NARC, Havre MT (a few examples) • Profitability of Spatially Variable vs. Uniform N Applications • Real-Time Sensing for Determination of Grain Quality • Predicting Nitrogen Status of Wheat from Remote Sensing and Terrain Data http://ag.montana.edu/narc/PDF%20Doc/Final%20Report.pdf
Precision Ag- Putting it all Together Managing field variations to improve economic returns and reduce environmental impact With today’s large acreage operations, understanding and adjusting for field variability is beneficial Precision Ag uses all or combinations of many of the technologies mentioned in this presentation
In Summary • Accurately assessing your field’s nutrient content and soil conditions will help you make better management decisions; many new technologies can assist you • Technology is becoming more user-friendly and accurate • The benefits vs. limitations of the tools you wish to use need to be assessed • There are many resources and knowledgeable people (crop advisers, research center faculty) to help you make your precision ag decisions
Information Resources • PARA: Precision Ag Research Association (a producer run association) http://www.montana.edu/places/para/site/start.htm • Precision AG Center out of U of Minnesota http://precision.agri.umn.edu/ • South Dakota University PA site: http://plantsci.sdstate.edu/precisionfarm/index.aspx • NDSU: Remote Sensing Basicshttp://www.ag.ndsu.edu/pubs/ageng/gis/ae1262w.htm
People to contact • Dr. Clain Jones – Soil Fertility Extension specialist (406) 994-6076, clainj@montana.edu • Dr. Rick Lawrence - Specializes in remote sensing (406) 994-5409, rickl@montana.edu • Dr. Rick Engel – Specializes in soil nutrient management (406) 994-5295, engel@montana.edu