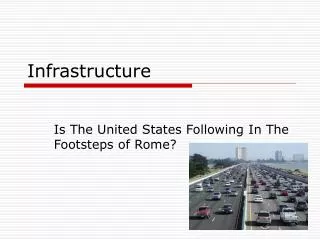
Infrastructure
Infrastructure. A Short Survey. How much is all the transportation infrastructure in Seattle worth? How do you rate Washington’s road conditions? (poor, mediocre, good, excellent) Is the Alaskan Way viaduct bored tunnel project necessary ? Is it too expensive?

Infrastructure
E N D
Presentation Transcript
A Short Survey • How much is all the transportation infrastructure in Seattle worth? • How do you rate Washington’s road conditions? (poor, mediocre, good, excellent) • Is the Alaskan Way viaduct bored tunnel project necessary? Is it too expensive? • Is the SR 520 Bridge project necessary? Is it too expensive?
Infrastructure The basic physical systems of a community's population, including roads, utilities, water, sewage, etc. These systems are considered essential for enabling productivity in the economy.
U.S. Gross Domestic Product a Includes all consumer and government purchases of goods (e.g., vehicles and fuel) and services (e.g., auto insurance) and exports related to transportation. b Includes all other categories (e.g., entertainment, personal care products and services, and payments to pension plans). 2008 data from the Bureau of Transportation Statistics
Federal Funding for Transportation • 2010 Federal Transportation Bill (THUD) • HR3288 (Transportation, Housing and Urban Development, and Related Agencies Appropriations Act, 2010) • Reauthorizes federal highway, public transportation, highway safety, and motor carrier safety programs for six years • $447 billion over 6 years • FY2010: $117.1 billion • 56% increase over SAFETEA LU • SAFETEA LU (old version) • Safe, Accountable, Flexible, Efficient Transportation Equity Act: A Legacy For Users • $286.4 billion in funding • 42% increase over last bill (TEA-21) • December 2010: extended through March 4th, 2011
Public Expenditures on Construction of Highways and Streets • Notes: • Annual spending (Nov 2010 seasonally adjusted): $86.9 billion total • Almost all public spending • Highways and streets = largest component of public transportation spending • Pavement is by far the largest part of that spending (about 70%) Data from BTS: FIGURE 1-3-19State and Local Expenditures on Highways and Streets Construction: January 1998–June 2009
Public Expenditures on Non-Roadway Transportation Construction • Notes: • Only state and local numbers reported • March 2010 seasonally adjusted annual spending: $32.2 billion total (about 37% of roads) • $15.8 billion on air transportation • $14.5 billion on land transportation (e.g., rail, bus, etc.) • $2.0 billion on water transportation Data from BTS: FIGURE 1-3-11 Public Expenditures on Nonroadway Transportation Construction: 1998-2009
Private Expenditures on Transportation Infrastructure Construction • Notes: • March 2010 seasonally adjusted annual rate: $8.26 billion total • $0.35 billion on air transportation • $7.77 billion on land transportation • $0.14 billion on water transportation Data from BTS: FIGURE 1-3-12A Private Expenditures on Transportation-Related Construction: January 1998–March 2010
American Recovery and Reinvestment Act (ARRA) • $787 billion economic stimulus bill • $30 billion for transportation • Washington Funding • $535 million for WA highway projects • $179 million in transit system capital projects
American Recovery and Reinvestment Act (ARRA) Data and graph from WSDOT
Seattle Transportation Infrastructure Inventory(not all are shown here but the total is right) 2008 data from http://www.ci.seattle.wa.us/transportation/inventory.htm
General Condition (old) and Age (poor)From the ASCE Report Card for America’s Infrastructure • Total estimated 5-yr funding need: $930 billion • Total estimated 5-year spending: $381 billion • Projected 5-year shortfall: $549 billion Rockefeller Road Bridge in Cleveland, OH from ASCE website from ASCE website Information from: ASCE Report card for Roads (http://www.infrastructurereportcard.org/fact-sheet/roads)
Alaskan Way Viaduct (current) Eroded viaduct deck All photos from WSDOT website www.wsdot.wa.gov Damaged beam after 2001 Nisqually earthquake
Alaskan Way Viaduct (2006)
Alaskan Way Viaduct (current) Installing column supportsafter the Nisqually earthquake All photos from WSDOT website www.wsdot.wa.gov Column support
SR 520 Bridge All photos from WSDOT website www.wsdot.wa.gov Cracks on the inside of floating pontoons Simulated Failure by Windstormhttp://www.youtube.com/watch?v=qchD9ltCPG8 Damage to hollow column in 1999 due to barge collision
Rural Road Conditions RuralRoadsin Poor or Mediocre Condition by Functional Class: 1995–2006 Graph from the Bureau of Transportation Statistics, Transportation Statistics Annual Report September 2008
Urban Road Conditions Urban Roads in Poor or Mediocre Condition by Functional Class: 1995–2006 Graph from the Bureau of Transportation Statistics, Transportation Statistics Annual Report September 2008
Bridge Conditions Structurally Deficient and Functionally Obsolete BridgesAll Roadways,1990–2007 Graph from the Bureau of Transportation Statistics, Transportation Statistics Annual Report September 2008
6:05 p.m. 1 August 2007 July 1967 – Minneapolis Tribune
Building Transportation Infrastructure Mega-Project Projects with an estimated total cost greater than $1.0 billion, or projects approaching $1.0 billion with a high level of interest by the public.
Periods of Mega-Projects in the U.S. • Pre-1950s era • Minimal higher-level aid • Very little disruption of existing areas • Great mega-project era (1950 – late 1960s) • Large amounts of federal aid • Retrofit cities for new preferences • Transition era (mid 1960s – early 1970s) • Community & environment become important • Citizen protests • Do no harm era (mid 1970s – present) • Investment is substantial at all levels • Must avoid or mitigate any significant disruption
Panama Canal From pancanal.com (official site) Information from www.pancanal.com
Golden Gate Bridge From Metropolitan Transportation Commission Information from the Virtual Museum of the City of San Francisco
Lake Washington Ship Canal Under construction (1916)
Lake Washington Floating Bridge UW Libraries 1940
First Concession to Citizens San Francisco, 1959City officials veto most further planned expressway construction in the city Picture from Halttheramp.com
Mitigation Begins From AARoads.com Philadelphia, 1965State alters Delaware Expressway design along the waterfront from elevated to depressed and covered.
Environmentalism • National Environmental Policy Act (NEPA) (1970) • Environment to be considered for all major federally aided projects • Public hearings • Authorizes citizen suits to ensure all issues are addressed fully and candidly • Agency still free to decide after EIS • Clean Water Act amendments (1972) • Difficult to fill wetlands (Section 404) • Runoff cannot pollute water resources (Section 402) • Clean Air Act amendments (1990)
Westway (Manhattan Island) • 1974 plan • $1.2 billion • Covered structure • On fill in the Hudson River • General political support
Westway (Manhattan Island) • Relatively Minor Issue Sinks Project • Do young stripped bass winter under rotting, unused piers that are scheduled to be removed by the project? • EIS: Few fish live under piers • NY and federal studies: Fish live under piers • U.S. Army Corps of Engineers needs further study • Failed to prove “no significant impact” • Clean Water Act says no fill permit can be issued • 1985 U.S. House vote to ban further federal funding • (NJ backs ban because Westway would move the bass over to the NJ side and potentially block NJ development)
Mitigation Costs • Century Freeway (I-105) – Los Angeles • 1977 cost estimate: $500 million • 1979 cost estimate: $1.6 billion • 4,200 units of affordable housing • Job training program • Minority contracting
Consensus/Mitigation Costs Boston Central Artery/Tunnel Project (“Big Dig”)
Consensus/Mitigation Costs • Boston Central Artery/Tunnel (CA/T)
Public Financing • Local sources • Private investment (not likely) • Excise taxes (hotel rooms, restaurants, rental cars, taxis) • Sales tax • Airport passenger facility charges (PFC) • Airport landing fees • Sales/lease of land at below-market prices • Loans, access to credit at below-market rates • State sources • Non-tax revenue: lotteries, tolls • Regional sales tax • Gas tax • Federal sources
Private Financing • Cintra, a subsidiary of the Spanish conglomerate, Ferrovial, develops and operates transportation infrastructure (http://www.cintra.es): • Chicago Skyway: 7.8 miles of toll road in Chicago, part of I-90 • Texas SH 130 Segments 5 & 6:Toll road • Indiana Toll Road: 157-miles long, leased for 75 years for $3.8 billion MQAMacquarie Atlas Roads • Macquarie Infrastructure Group, part of Macquarie Bank (an Australian bank), develops and operates transportation infrastructure http://www.macquarie.com/mgl/com/mqa): • Chicago Skyway: 7.8 miles of toll road in Chicago, part of I-90 • Indiana Toll Road: 157-miles long, leased for 75 years for $3.8 billion • Dulles Greenway: 13.7 miles, Dulles to Leesburg, VA, $533 million • South Bay Expressway: 9.3 miles of toll road in SD, built for $635 million • Sea-to-Sky: 62 miles, Vancouver to Whistler, $600 million
Chicago Skyway • $1.83 billion for 99 year lease by Skyway Concession Company • Toll revenues = $38-45 million annually
Chicago Skyway Tolls Map from Skyway Concession Company
South Bay Expressway Pictures from SBX (www.southbayexpressway.com)
South Bay Expressway Opened November 2007 Picture from SBX (www.southbayexpressway.com) Picture from Macquarie
Trends in Mega-Projects • Not routine after 1970 • Support coalitions • Usually led by business enterprise • Project ideas • Usually originate in the public sector • Only successful if they “do no harm” • Mitigation is essential • Support and purpose is local • Avoid increases in broad-based local taxes • Costs rose dramatically from 1970 – 2000 • Private investment (2004 – present) From Altshuler and Luberoff (2003) Mega-Projects: The Changing Politics of Urban Public Investment
Cost Effective? The Stack (LA): I-105 (E-W), I-405 (N-S)
Rising Costs Cost per Centerline Mile