Dividend Portfolio Strategy
210 likes | 371 Vues
Dividend Portfolio Strategy. Whiddon Wealth Management, LLC. Securities offered through LPL Financial. Member FINRA/SIPC. The Power of Compound Interest. "Compound interest is the eighth wonder of the world. He who understands it, earns it ... he who doesn't ... pays it." Albert Einstein.

Dividend Portfolio Strategy
E N D
Presentation Transcript
Dividend Portfolio Strategy Whiddon Wealth Management, LLC Securities offered through LPL Financial. Member FINRA/SIPC
The Power of Compound Interest "Compound interest is the eighth wonder of the world. He who understands it, earns it ... he who doesn't ... pays it." Albert Einstein Albert Einstein when asked what he considered to be the most powerful force in the universe answered: “Compound interest! What you have become is the price you paid to get what you used to want.” Mignon McLaughlin, American Journalist
Compound interest is interest that is calculated not only on the initial principal, but also the accumulated interest of prior periods. Compound interest differs from simple interest in that simple interest is calculated solely as a percentage of the principal sum. The equation for compound interest is: P = C(1 + r/n)nt. The components for the equation of compound interest is: P = Future Value C = initial deposit r= interest rate (expressed as a fraction: eg. 0.06 for 6%) n= # of times per year interest is compounded t = number of years invested. Hopefully, most of us are aware of compound interest calculations. How exactly do you calculate the compound interest with a given percentage of yearly returns? Building off of the equation for the compound interest above, here is another example using the formula that will help you accomplish the task, but using actual numbers. Suppose you are investing $200,000 for 6 years at a compounding interest rate of 10% per year. This would be the calculation: Amount investing (1+Interest %)*years. $200,000 (1+10%)*6 = The total amount you are going to receive at the end of the 6 year should be $354,312.20. This example does not reflect any account fees, transaction charges, taxes and/or inflation associated with any particular investment. Such expenses, when levied, would reduce overall returns. The example is for illustrative purposes only and is not intended to imply or represent a guarantee of any specific return of any particular investment. Investment results fluctuate and can decrease as well as increase. Distributions, when taken, are subject to federal and state taxes as ordinary income. The Power of Compound Interest : Defined
The Power of Compound Interest Interest Rates Really Are Interesting "Yeah, interest. It's an amazing thing. You make money without doing anything..." "Y'know, I have friends who try to base their whole life on that principle." "Really? Who?" "Nobody you know...“ Jerry and George - Seinfeld TV Show
What is more powerful than Compound Interest? Compound Dividends! “Compound Dividends are like compound interest on steroids, figuratively speaking” “Good dividend stocks’ yield, tends to stay within a given range, so if dividends are increasing each year, the only way to keep a consistent yield is for the price of the stock to go up.” Source: Dividendvalue.com
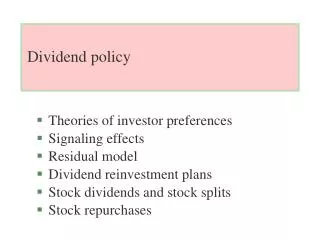
The Advantages of Dividend Paying Stocks 1.Dividends may appeal to investors who desire stable cash flow but do not want to incur the transaction costs from periodically selling shares of stocks. 2.Behavioral finance argues that investors with limited self-control can meet current consumption needs with high-dividend paying stocks while adhering to the policy of never dipping into principal. 3. The board of directors, acting on behalf of the stockholders, can use dividends in order to reduce cash available to spendthrift managers. 4. Dividends have long been a signal or indicator of company health to investors. A constant dividend offers a sense of confidence to investors the company is doing well, and views future potential to be equally as sound. 5.The dividend approach gives a greater opportunity to beat inflation, over time, than a bond-only portfolio. Ross,Westerfield,Jaffe (2008) Corporate Finance
The Disadvantages of Dividend Paying Stocks General risks inherent to investments in stocks include the fluctuation of market prices and dividend*, loss of principal, market price at sell may be more or less than initial cost and potential illiquidity of the investment in a falling market. Small-cap stocks may be subject to a higher degree of risk than more established companies’ securities. The illiquidity of the small-cap market may adversely affect the value of these investments. Furthermore, the prices of small company stocks are generally more volatile than those of large company stocks. *Fluctuations in the market prices of stocks can often cause expected dividend payments to fluctuate and change as well. It must also be noted that past performance and/or past payments is not an indication of future results.
Dividend Portfolio Strategy Goal: • To concentrate on higher current dividend yields that have also a history of annual dividend increases in order to increase portfolio performance while reducing risk Reason: • Tangible confirmation of management’s confidence in future earnings growth • Generation of higher levels of income over a long period of time if reinvesting dividends
Screening Methodology Objective: To apply quantitative criteria to the wide universe of dividend stocks in order to narrow it down to few companies. This will allow us to concentrate on a more promising group of dividend stocks, our high probability dividend stocks!
Master List (250 stocks) Popular List Current List Screen Based List Scoring Process Stock Universe Top 25 Dividend Stocks
Screening Process STOCK UNIVERSE Screen Based List DRPs High Yield Dividend Growth Dividend Yield High Div & Growth Dividend Yield & Profitability Master List Scoring Process TOP 25 DIVIDEND STOCKS
Description of the Screens • DRPs High Yield Screen: DRPs companies with high relative yields, reasonable dividend payout ratios and high growth • Dividend Growth: Looking for stable companies that are in the maturity stage of their life cycle, above-average dividend growth rates. • Dividend Yield: Screen that looks for undervalued stocks using the dividend-yield approach (companies with secure dividends – example: specifying a maximum level of dividend payout ratio of less than 50%) • High Div&Growth: Screen that focuses on high-quality growth stocks that have higher dividends and lower price volatility • Dividend Yield & Profitability: Screen that looks for companies with increasing profitability and reasonable dividend yield • Current List: List that comes from our experienced advisors.
Dividend Screens* *The formulas have been altered to protect Proprietary Information
Screen 1: DRPs with High Yield • Provides DRP plan • Yield >= 3 • Dividend 12m >= Dividend Y1 • Dividend Y1> Dividend Y2 • Dividend Y2>Dividend Y3 • Dividend Y3 > Dividend Y4 • Dividend Y4>Dividend Y5 • Dividend Y5>Dividend Y6 • Dividend Y6>Dividend Y7 • Dividend Gr. 5Y> Industry Div-Gr. 5Y • Yield > Yield-Avg. 5 Y • Payout ratio 12 <= 60% • EPS-Gr. 5 Yr >= Industry EPS-Gr.5Y • ADR/ADS Stock is false
Master List Top 250 Dividend Stocks Scoring Process • Criteria for scoring: • Consistent Growth • Increasing Profitability • Good Financial Health • High Dividend Yield TOP 25 DIVIDEND STOCKS
Capital asset pricing model (capm) • A model that describes the relationship between risk and expected return and that is used in the pricing of risky securities. • General idea behind CAPM: investors need to be compensated in two ways: time value of money and risk. • The time value of money is represented by the risk-free (rf) rate in the formula and compensates the investors for placing money in any investment over a period of time. • The risk is represented by beta and calculates the amount of compensation the investor needs for taking on additional risk (risk premium) • The CAPM says that the expected return of a security or a portfolio equals the rate on a risk-free security plus a risk premium. Investopedia, January 2011
Deep Thinking in the Scoring Process • 36 variables in the Scoring Process, including: • Dividend Growth • Free Cash Flow • Return on Equity • Sales Growth…
Dividend Analysis • Yield Growth: Combination of dividend yield and dividend growth rate analysis. High value on this category indicates stocks with above average yield and long-term growth. • Dividend Analysis: In-depth analysis of dividend stocks considering payout ratio, P/E ratio, earnings yield and dividend yield. • Dividend Growth: Concentrates on sustainable growth rate, the maximum growth rate that a firm can sustain without having to increase financial leverage. • Strong Dividend Valuation: Focuses on strong dividend stocks: a record of dividend increases over time. • Margin of Safety: Determines the margin of safety of the stock based on dividend valuation approach.
Importance of Ex-Dividend Date • Investment term related to the payment of dividend. • Defined by the IRS as “the first date following the declaration of a dividend on which the buyer of a stock is not entitled to receive the next dividend payment.“ • Theoretically, the closer to the ex-dividend date, the higher the stock price. On the ex-dividend date the stock will drop the amount by the dividend amount.
Glossary of Screen-Based Tests • 12M = Recent 12 month period • 1Q = Recent quarter. • ADR = American Depositary Receipt = A negotiable certificate issued by a U.S. bank representing a specified number of shares (or one share) in a foreign stock that is traded on a U.S. exchange. • ADS = American Depositary Share = A U.S. dollar-denominated equity share of a foreign-based company available for purchase on an American stock exchange. • Cash Flow = a revenue or expense stream that changes a cash account over a given period. • Dividend = A distribution of a portion of a company's earnings, decided by the board of directors, to a class of its shareholders. • DRP = Dividend Reinvestment Plan = A plan offered by a corporation that allows investors to reinvest their cash dividends by purchasing additional shares or fractional shares on the dividend payment date. • EPS = Earnings Per Share: the portion of a company’s profit allocated to each outstanding share of common stock. • Gr. = Growth. • LT Debt/Equity Ratio = Long-Term Debt/Equity Ratio: a measure of a company’s financial leverage calculated by dividing its long-term debt by stockholders’ equity. • Payout Ratio = The amount of earnings paid out in dividends to shareholders • Sector = An industry or market sharing common characteristics. Investors use sectors to place stocks and other investments into categories like technology, health care, energy, utilities and telecommunications. Each sector has unique characteristics and a different risk profile. Investopedia AAII
Glossary of Screen-Based Tests • ROE = Return on Equity: the amount of net income returned as a percentage of shareholders equity. • Yield = This refers to the interest or dividends received from a security and is usually expressed annually as a percentage based on the investment's cost, its current market value or its face value. • Y1 = Recent Year • Y = Yearly (example: Y EPS= Yearly EPS), or Years (example: 3Y= 3 Years) Investopedia AAII