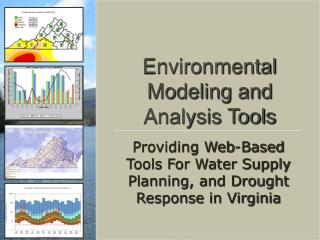
Environmental Modeling and Analysis Tools
Environmental Modeling and Analysis Tools. Providing Web-Based Tools For Water Supply Planning, and Drought Response in Virginia. Web-based Analysis/Modeling. New Features of Drought Monitoring Web Site: Average use percentages by category Average use by month, consumptive/non-consumptive

Environmental Modeling and Analysis Tools
E N D
Presentation Transcript
Environmental Modeling and Analysis Tools Providing Web-Based Tools For Water Supply Planning, and Drought Response in Virginia
Web-based Analysis/Modeling • New Features of Drought Monitoring Web Site: • Average use percentages by category • Average use by month, consumptive/non-consumptive • Upcoming analysis tools: • Drought prediction • Estimated effectiveness of different conservation measures • Ultimate Goal: enable more effective demand management and drought response
Demand Management Versus Drought Response • A demand management plan: • Increases the efficiency of water-dependent operations during non-drought times • Insures that everyone is “doing their part” • Results in more water all the time • A Drought Contingency Plan • Identifies areas where short term reductions as practical, affordable, and effective • Results in more water at critical times
System Goals • Provide Integrated Data Acquisition, Analysis, and Modeling • Connect to web-based data sources with automated retrieval • Utilize internal DEQ databases, such as VPDES and VWUDS • Create a centralized system to permit geo-statistical analysis of monitored data • Integrate data with hydrologic modeling software for long-term impact analysis and short-term prediction • How: • Leverage Existing Web-Based Data Sources • Make in-house data sources web accessible • OO System for integrating of models and data
Monitoring System Data USGS Flow Duration Groundwater Rainfall Water Use and Timing
A Tale of Two Neighbors • Seasonal • Agriculture • Public • Fossil Power • Non-Seasonal • Commercial • Industrial
Consumptive / Non-Consumptive • Consumptive – water not returned to stream • Non-Consumptive = Withdrawal – Consumptive • Reduction of consumptive uses may have more impact
Drought Web: Site Tour Site Hosted at: http://www.deq.virginia.gov/watersupplyplanning/drought/ Currently 3 Different Regional Views: • State Drought Regions • Shenandoah Valley Regions • New River • Mecklenburg and Brunswick Counties
Modeling System Components Web-Based Data Analysis and Acquisition System • Multi-user, web-based, password protected analysis and modeling system • Data entry: water use reporting, VWP permit conditions • Data mining: Connects to many forms of online data (NWIS, NOAA, VPDES, etc.) • Spatial analysis: PostgreSQL/ PostGIS • Geolocation: GoogleMaps integration for GIS shape editing and “look and feel” • Modeling: HSPF, GWLF, CE-QUALW2, and custom designed dynamic systems models run via web interface
Hi-res Precipitation Versus Stream Flow Comparison of Adjacent Basins ~ 20 mi apart 1.4” Precip ~85% Flow (2 cfs/sqmi peak flow) 2.4” Precip >97% Flow (8 cfs/sqmi peak flow)
Analyzing Recharge Window • Precip at ~70% during recharge period • Late spring and summer precip > 115%, bringing annual total to near 90% • Despite higher than normal precip during summer, summer base flows ranged from 5-15%
Modeling Drought Impacts • Use hydrologic model to compute running estimates of soil moisture, ET, and ground water: • based on monitored meteorological drivers • Use NOAA forecasts (point based grid) to supply model inputs: • 1-3 day: precipitation, temperature, humidity, wind • 4-14 day: precipitation, temperature • 15-180 day: probability of temp/precip above/below normal • Develop probabilistic analysis of drought effects • Soil moisture at wilting • low groundwater levels • dry 1st order streams
Conclusions • If successful, these models may be used to: • develop more accurate drought forecasting, • Develop better, more informed drought contingency plans • Inform decision makers about specific effects of an ongoing drought • And therefore, provide a higher probability of avoiding human aggravation of drought impacts • Provide more usable water