Download
1 / 25
250 likes | 415 Vues
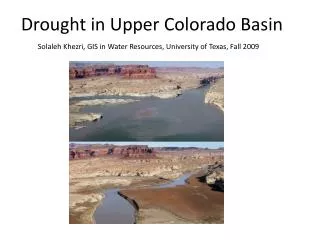
A. U. Multi-Basin Drought and Arizona Water Supply A Tree-Ring Perspective. Dave Meko Katie Hirschboeck Elzbieta Czyzowska, Jennifer Lee Kiyomi Morino Laboratory of Tree-Ring Research, University of Arizona Funding from The Salt River Project.

E N D
A U Multi-Basin Drought and Arizona Water SupplyA Tree-Ring Perspective Dave Meko Katie Hirschboeck Elzbieta Czyzowska, Jennifer Lee Kiyomi Morino Laboratory of Tree-Ring Research, University of Arizona Funding from The Salt River Project 22nd Pacific Climate Workshop, March 26-29, 2006 Asilomar State Beach & Conference Grounds , Pacific Grove , California
Roosevelt Dam Reconstructed PDSI Average for 1902-1904 Data from: http://www.ncdc.noaa.gov/paleo/pdsi.html Capacity = 1.6 million acre-ft Constructed 1905-1911 (http://www.usbr.gov/dataweb/dams/az10317.htm)
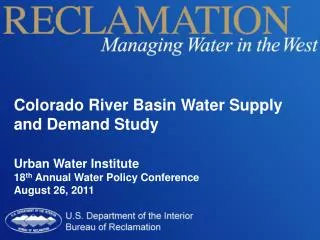
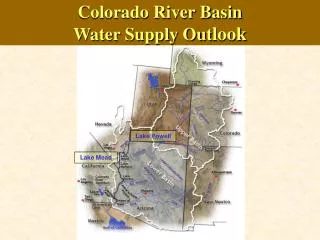
Colorado River as Buffer? • Central Arizona Project (CAP) • Important REMOTE supplemental source of water: Colorado River • Helped out in recent drought • Two widely separate source regions for water • What is risk of double-whammy? • SRP-sponsored tree-ring study http://www.cap-az.com/ http://fp.arizona.edu/khirschboeck/srp.htm
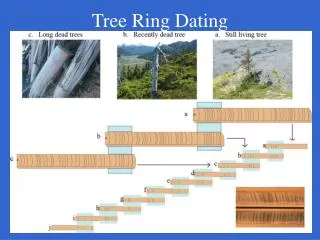
Tree Ring Networks Upper Colorado Basin Salt, Verde, & Tonto Basins Sub-period networks 1279-1964 1521-1964 A.D. 1199-1988
Reconstruction Model Watershed boundary as guide Time coverage from target droughts Select tree-ring sites Converts each chronology into separate estimate of the streamflow series using distributed-lag regression Single-site regression/reconstruction • Condenses common modes of variability in the single-site reconstructions • Run on the covariance matrix to retain importance of chronology differences in explained streamflow variance PCA data reduction Multi-site regression/reconstruction Weights the modes of variation in single-site reconstructions into best estimate of streamflow
R2=0.77 RE=0.74 R2=0.70 RE=0.68 Speculative Common Period = 1521-1964 Reconstructed Flows
Defining Joint Drought * Colorado (north) / Salt-Verde-Tonto (south) LH = Dry Colo, Wet Salt-Verde HL = Wet Colo, Dry Salt-Verde HH = Wet in both basins LL = Dry in both basins * Thresholds for L, H defined by 25th and 75th percentiles of annual flows
Observed Flows & Thresholds Thresholds from observed flows Thresholds from reconstructed flows
Reconstructed Flows: HL and LH Events Probability (HL) = 0 / 444 = 0 Probability (LH) = 67 / 444 = 0.004
Reconstructed Flows: LL and HH Events Probability (HH) = 57 / 444 = 0.128 Probability (LL) = 66 / 444 = 0.149
Clustering of LL and HH Events Single occurrence of a synchronous extreme year (LL or HH) event CLUSTERING of synchronous extreme years within an n-year moving window
Storage Look at Low Frequencies • Colorado River (L. Mead and above) • 14 reservoirs with capacity > 18 kafa • 61.4 maf of storage (~ 4.1 years of storage) • Salt + Verde + Tonto Rivers • 4 reservoirs on Salt River, 2 on Verde Riverb • 2.7 maf of storage (~ 2.7 years of storage)
Joint Lows in Smoothed Reconstruction Smoothed series simultaneously below 0.25 quantile
Cross Spectral Analysis, 1521-1964Lees Ferry and Salt+Verde+Tonto
Correlation and Cross Spectrum in Sliding Time Window 5 yr 65 yr
higher-than-normal pressure over both basins lower-than-normal pressure over both basins Climate 500 mb Height Anomalies (LL and HH years from observed flows) LL WATER YEARS HH WATER YEARS LOW PRESSURE HIGHPRESSURE HIGH PRESSURE 500 mb Geopotential Height (m) Composite Anomaly, Oct-Sep water year
+ AMO - AMO El Niño La Niña - AMO (cool North Atlantic) Relationships less clear w/ other indices – PDO (cool phase) + PDO (warm phase) + PDO PDO / AMO Hypothesis supported in many, but not all, LL events of last century - PDO El Niño La Niña Link to Sea Surface Temperature Indices? + AMO (warm North Atlantic)
Nov 11, 2005, Mogollon Rim N of Payson, AZ This Year?
Nov 2005 Dec 2005 Jan 2006 Feb 2006 Precipitation Anomalies (% normal) http://www.ocs.oregonstate.edu/prism/products/matrix.phtml?view=data
500mb Height Anomaly Jan – Mar 21, 2006 Oct – Dec, 2005
March 1, 2006, Assessment Snowpack Streamflow Forecast http://www.wcc.nrcs.usda.gov/wsf/westwide.html
Reservoir Storage, End of Feb 2006 Data from: ftp://ftp.wcc.nrcs.usda.gov/data/water/basin_reports/arizona/wy2006/barsaz2.txt
Conclusions • Water deficits due to Arizona droughts are unlikely to be offset by water excesses in the UCRB • Reservoir storage and the high volume water supply of the large UCRB may allow continued buffering during climate stress • Increasing demand and climatic change are additional factors that may exacerbate the effects of joint drought • Preliminary examination of El Niño, La Niña influences and ocean indices such as the Pacific Decadal Oscillation (PDO), and the Atlantic Multidecadal Oscillation (AMO)suggest linkage to some – but not all joint droughts