Government Process Reengineering
Government Process Reengineering. 29 th September, 2016 B Krishnamurthy (BKM). Agenda. Introduction to Process Re-engineering Context of Process reengineering with reference to Government services GPR life cycle Metrics to measure. Defining Business Process Reengineering (BPR).

Government Process Reengineering
E N D
Presentation Transcript
Government Process Reengineering 29th September, 2016 B Krishnamurthy (BKM)
Agenda • Introduction to Process Re-engineering • Context of Process reengineering with reference to Government services • GPR life cycle • Metrics to measure
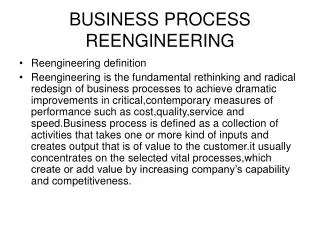
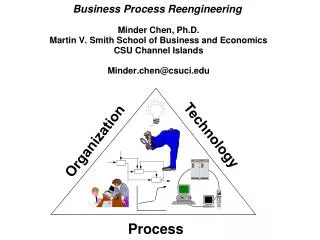
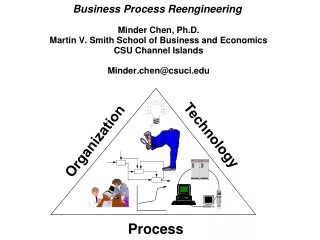
Defining Business Process Reengineering (BPR) • BPR is fundamental rethinking and radical redesign of business processes to achieve dramatic improvements in critical, contemporary measures of performance, such as cost, quality, service and speed Michael Hammer and James Champy • ‘Changing’/’redesigning’/’replacing’/’eliminating’ the activities and/or sub-processes and/or processes related to a service to improve service quality i.e. • Minimize Time, Cost, Complexity • Improve Transparency, Convenience and Experience • GPR may address all or some of the service quality attributes • Government Process Re-engineering (GPR) has evolved from applying Business Process Re-engineering (BPR) concepts to Government Services
Need for GPR in e-Governance • IT enablement (without) GPR provides results to the stakeholders, but may not address all the attributes of service quality • In particular, IT enablement of an inefficient business process can only lead to ‘inefficient IT enabled process’ – delivering the same results with marginal improvement • GPR may support organizations in dramatic improvement of performance and application of IT on reengineered processes will yield better results for stakeholders High Dramatic Improvement through BPR Performance Measure Benefits through Typical Quality Initiatives Low Time
BPR/GPR success stories • Passport Seva Project Passport Application and Issuance of passport • Physically going to the Regional Passport Office • Filling up and submitting form, at the counter • Verification of documents • Payment of requisite fee • Sending request to jurisdictional police station for verification • Physical verification by police at a later date • Sending of police verification report to RPO • Approval of passport and delivery through post office Total time could be between 30 to 45 days from submission of application to delivery of passport
Government Process Re-engineering Can • Increase the speed at which document intensive processes are conducted and reduce associated costs and administrative burdens • Add flexibility to organisational processes, allowing your business to scale up or down as required by customer or internal demand • Help reduce capital expenditure by reducing the need to invest in the assets required to perform a service internally • Organise information and documents with electronic document management systems and processes, for example transition to electronic invoicing • Minimise document loss and information leakage • Utilise electronic document formats more often in internal and customer transactions • Improve operational efficiency and customer service levels • Mitigate risk by improving compliance to legal requirement
GPR In e-Governance Project Lifecycle 1. E-Governance Strategy Development 2. Current State Assessment 3. Future State Definition 4. Implementation approach and sourcing 5. Develop and implement IT system 6. Operate and sustain Project Management Office/Unit Change Management and Communications GPR GPR is undertaken during stages 2 and 3 of eGLC
Approach to GPR Problem Identification and Definition • Analysis of citizen grievances & complaints and pro-active Voice of Customer surveys • Analysis of issues raised • Identification of problem and defining unambiguous problem statements
Approach to GPR Define vision and objectives for GPR • Analyse services portfolio and undertake service prioritisation exercise • Define vision for GPR, from problems identified, service priority • Define measurable objectives for the GPR exercise
What is ‘Vision’? Vision is a succinct and inspiring statement of what the organization intends to become and to achieve at some point in the future. • Before embarking on GPR initiative, make sure you have a vision that provides a roadmap and guidance for the GPR exercise • A vision statement takes into account the current status of the organization, and serves to point the direction of where the organization wishes to go • The vision statement provides the direction for the organization, while not inhibiting the approach or strategy to reach the desired goal • Vision is about ‘what’ will be achieved through GPR • To provide direction and guidance to the GPR • To clearly identify the measurable benefits from performing GPR • To clearly identify the actionable and measurable initiatives for achieving the stated goals/benefits
Why Vision for GPR? 4 Key Questions • Why are we doing this GPR for? • What are we going to do? • How will we know that we are successful (at the end of the project)? • How could we fail (& what must we do to avoid that)? • Why have a GPR Vision? • To develop a shared understanding of the desired end-state amongst the Organization and team • To drive achievement orientation in the organization • A good GPR Vision is one which: • Is in line with the organizational vision & e-Gov vision • Provides clarity to the organization and GPR team on goals and objectives • Sets goals
GPR Vision A vision statement should: • Be clear, intuitive and simple • Reflect the specific conditions and ambitions of the organization • State what will be and will not be done • Consider needs and opportunities • Be aligned with overall development strategy • Involve consensus building by stakeholders
GPR Vision Example • E-Biz India • Establish One-stop-service delivery centre for G2B Services in India, provide services in simplified and convenient manner and thereby improving the investment climate in the country • E-Procurement GoAP: • Establish common procurement platform for realizing the right value for the goods & services, minimizing the cost of procurement and providing equal opportunities for businesses
GPR Objectives • An objective is a specific and usually quantifiable statement of program achievement • It is a statement of measurable outcome which can be used to determine program progress towards the goal • Collectively, objectives represent a quantification of the program goal • GPR objectives translate the broad values within a GPR vision into more real and tangible outcomes, with stronger operational basis, reflecting actual process, procedures and measurable outputs • Should have measurable criteria for achieving success
GPR Objectives – bad examples… • To ensure that welfare benefits of government are reaching the eligible families • To ensure that Land records management framework provides ownership of the properties • To minimize time to receive the welfare benefits…
Approach to GPR Process Study and Documentation • Study process flow, actors, policies, process stages • Documenting as-is processes and creating Process Maps • Recording time and other data elements for each process step • Validation of process documentation from dept. • Identify and classify PIEs for the processes
Current State Assessment To perform an in-depth assessment of business functions and services identified for coverage under e-Governance project to understand: • Current approach for performing the business functions and service delivery • The key challenges and to identify improvement areas • Stakeholder needs and expectations • Good practices and learnings from similar implementations in similar domains • Current systems (IT) implemented in the department, coverage and gaps • Organization structures and people capacities etc
Current State (As-Is) Assessment As-Is Assessment is carried out along the following dimensions:
Current State Assessment Key Outputs/Deliverables As-Is IT Environment As-Is Processes As-Is People Environment • Organizational structures • Roles and responsibilities • Capacities and skill sets • Change barriers.. • Process maps • Pain points • Initial improvement areas • Stakeholder needs • IT Systems • Scope and functionality • Strengths and gaps • IT Infrastructure (network, security, data center)
Process MappingUnderstanding How Things Happen “Actually” Why Process Mapping? • To understand “how do we actually work” as opposed to “how are we supposed to work” • To understand the four attributes of process: • Players • Process flow • Policies, Standards and Responsibilities • Phases with clear start & end-points and process time-lines • To identify the Critical to Process metrics • To identify “Quick Wins” in the process • To understand response time & cycle time • To determine process efficiency • Value-added activities • Non value-added activities • To estimate the cost of the process • The concept of waste
Types of Process Mapping • Process mapping can be done at various levels of detail • Value Stream Mapping • Mapping the entire value stream of the process on a single page • SIPOC Map (Supplier – Input – Process – Output – Customer) • Mapping the key constituents of the process and their interactions • Flowcharting • Detailed activity / task level graphical representation of the process
Flow Diagrams " Draw a flowchart for whatever you do. Until you do, you do not know what you are doing, you just have a job.” Dr. W. Edwards Deming
The Four Field Mapping Template (1) Phase (2) Standards / Policies / Templates (3) The players involved in the process (4) The actual process activity wise
Approach to GPR Process Analysis • Root cause analysis of process issues and identification of root causes • Analyzing process efficiency - Value Adding and Non Value Adding steps • Analyzing process complexity – Data entry points, Hands off points etc • Definition of key metrics and arriving at baseline indicators (TAT, error rate etc)
Indicators of Poor Process • Too much movement • Too much re-entry and or copying • Standard formats not easily available • Process too much disintegrated • Process needs many manual inputs requiring references from other documents • Customers need to provide same information and or data multiple times • Activities, information, data that does not serve any purpose and can be eliminated • Activities, information, data, documents that can be integrated • Activities, process can be simplified • Activities, process, information, data that can be automated • Process where 3 major benefits of Information Technology viz. Independence from PLACE, TIME & PERSON can be utilized. • The process is ‘MULTIPLE WINDOW’
Identify the Problems, Issues and Expectations with the process • Problems • Non-conformance to defined processes and procedures due to skill gaps, lack of common understanding, resource constraints, etc. • e.g. documentation not completed as per guidelines/checklist • Issues • Systemic gaps where processes and procedures are not defined or are ill-defined • e.g. lack of clarity of process • Expectations • Expectations that process owners, users and other stakeholders have from world-class best practices • e.g. Service delivery within minutes/self services/online services
Problems, Issues & Expectations (PIES) • After generating the PIEs for the process, they are logically grouped • The next step is to brain-storm ‘Quick Wins’ & change possibilities in the process • Key PIEs, especially related to process, are analyzed for root causes in the Analyze phase • Other PIEs are reviewed in the Improve phase to ensure that the new process addresses all or most of them PIE Grouping
Sample Process Map with Problems, Issues & Expectations Absence of token system Physical presence required Check done at final stage Manual data entry
Transport / Handling T Moving people, information and/or things from one location to another Redundancy / Duplication R Rework; unnecessary or duplicate performance of a task Inspect ion / Verification I Ensuring a task was performed correctly / Checking / Reviewing Preparation P Getting ready to perform a task / Prepare to do work Non-Value Added activities An activity that provides the business process with no competitive advantage and which can be discarded without influencing the final outcome
Replacing processes completely; Removing the process Outsourcing the process Automate the process Process Reengineering Principles (contd..)
Approach to GPR Process Reengineering & Defining To-be processes Elimination or automation of Non Value Adding / redundant activities Identification of solutions (re-engineered process) Evaluation and selection of best solution Definition of To-be processes based on the evaluation Finalization of To-be processes with department Setting of target KPIs
Define Future State (To-be Definition) • To define how the identified business functions and services shall be performed going forward • To define the new business processes • To define IT solutions and services for automation of new business processes • To define people change management, capacity building and communication requirements for project implementation
Define Future State (To-be Definition) • To-be definition is performed along the following dimensions:
Define Future State (To-be Definition) • Key Outputs /Deliverables To-Be IT Environment To-be People Environment To-be Processes • To-be business processes • New process KPIs/metrics • Changes to the legal and policy environment • Functional Architecture and Requirements specifications • Enterprise Architecture covering Application, data, network, security, data center architecture • Data digitization and migration strategy • SLAs • Institutional structures needed for project implementation • Training and Capacity building plan • Change Management Plan • Communications Management Plan
Redesigning existing processes Elimination of non-value added activities, organize the process around the outcomes Building quality in the source… Reworking the way a process is executed; process tasks and steps may remain largely the same but how and where the process is executed may be changed E.g. where several different personnel who undertake different tasks in a process are located in different areas of a building, co-locating these individuals into work cells or work groups to facilitate closer cooperation, reduce errors and speed up throughput Process Reengineering Principles
Customer goes to Railway Ticket booking counter Waiting in queue by customer to submit form Submission of filled application form to clerk at booking counter Collection and filling of application form by customer Confirmation of ticket details from customer by clerk Booking and printing of ticket on government stationary by clerk Clerk receiving payment from customer Checking availability of ticket by clerk Yes No Customer plans alternate ticket Average time taken to book a ticket: 2 to 3 hours Before Existing Identifying Non-Value Add activities
Definition Of Key Metrics • The key metrics (CTQs & CTPs) of the process acts as indicators of how the process has improved post GPR • From the data collected on the CTQs and CTPs, the baseline metrics can be obtained • Post roll-out of GPR, these metrics can be tracked for continuous improvement using Process Quality Information Systems (PQIS)
Performance Indicators • Cost indicator • Time indicator • Demand indicator • Productivity indicator A comparison of these measures for the old and redesigned process will show the improvement achieved in performance.
Thank you bkm.krishnamurthy@gmail.com bkmurthy@bkms.in