
Enhancing Adolescent Well-Being through Social Connectedness: A Longitudinal Study
This study explores the impact of connectedness domains (family, friends, school, community) on well-being in early adolescents over time. Results show a predictive relationship between connectedness and well-being, emphasizing the importance of fostering connections for adolescent mental health. The study, conducted in New Zealand, involved almost 2,000 participants and supported the notion that supporting adolescents' connections positively influences their overall well-being. Contact researchers Paul Jose and Jan Pryor for further information. Published in 2008 by the Roy McKenzie Centre for the Study of Families, Victoria University of Wellington.

Enhancing Adolescent Well-Being through Social Connectedness: A Longitudinal Study
E N D
Presentation Transcript
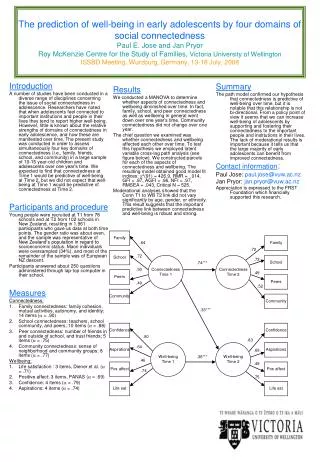
Introduction A number of studies have been conducted in a diverse range of disciplines concerning the issue of social connectedness in adolescence. Researchers have noted that when adolescents feel connected to important institutions and people in their lives they tend to report higher well-being. However, little is known about the relative strengths of domains of connectedness in early adolescence, and how these are manifested over time. The present study was conducted in order to assess simultaneously four key domains of connectedness (i.e., family, friends, school, and community) in a large sample of 10-15 year-old children and adolescents over one year’s time. We expected to find that connectedness at Time 1 would be predictive of well-being at Time 2, but we did not expect that well-being at Time 1 would be predictive of connectedness at Time 2. Participants and procedure Young people were recruited at T1 from 78 schools and at T2 from 102 schools in New Zealand, resulting in 1,961 participants who gave us data at both time points. The gender ratio was about even, and the sample was representative of New Zealand’s population in regard to socioeconomic status. Maori individuals were oversampled (34%), and most of the remainder of the sample was of European NZ descent. Participants answered about 250 questions administered through lap-top computer in their school. Measures Connectedness: Family connectedness: family cohesion, mutual activities, autonomy, and identity; 14 items (a = .90) School connectedness: teachers, school community, and peers; 10 items (a = .88) Peer connectedness: number of friends in and outside of school, and trust friends; 5 items (a = .75) Community connectedness: sense of neighborhood and community groups; 8 items (a = .77) Wellbeing: Life satisfaction : 3 items, Diener et al. (a = .71) Positive affect: 3 items, PANAS (a = .69) Confidence: 4 items (a = .79) Aspirations: 4 items (a = .74) Summary The path model confirmed our hypothesis that connectedness is predictive of well-being over time, but it is notable that this relationship is not bi-directional. From a policy point of view it seems that we can increase well-being of adolescents by supporting and fostering their connectedness to the important people and institutions in their lives. The lack of moderational results is important because it tells us that the large majority of early adolescents can benefit from improved connectedness. Contact information: Paul Jose: paul.jose@vuw.ac.nz Jan Pryor: jan.pryor@vuw.ac.nz Appreciation is expressed to the FRST Foundation which financially supported this research. The prediction of well-being in early adolescents by four domains of social connectednessPaul E. Jose and Jan Pryor Roy McKenzie Centre for the Study of Families, Victoria University of WellingtonISSBD Meeting, Wurzburg, Germany, 13-18 July, 2008 Results We conducted a MANOVA to determine whether aspects of connectedness and wellbeing diminished over time. In fact, family, school, and peer connectedness as well as wellbeing in general went down over one year’s time. Community connectedness did not change over one year. The chief question we examined was whether connectedness and wellbeing affected each other over time. To test this hypothesis we employed latent variable cross-lag path analysis (see figure below). We constructed parcels for each of the aspects of connectedness and wellbeing. The resulting model obtained good model fit indices: c2(91) = 426.9, RMR = .014, GFI = .97, AGFI = .96, NFI = .97, RMSEA = .043, Critical N = 525. Moderational analyses showed that the Conn T1 to WB T2 link did not vary significantly by age, gender, or ethnicity. This result suggests that the important predictive link between connectedness and well-being is robust and strong. Family .64 Family .72 .72 School .73 .74*** Connectedness Time 1 Connectedness Time 2 School .50 .49 Peers Peers .49 .52 Community Community .33*** Confidence Confidence .80 .83 .64 .69 Aspirations Well-being Time 1 Well-being Time 2 Aspirations .36*** .46 .49 Pos affect Pos affect .74 .75 Life sat Life sat


