Download
1 / 61
1.22k likes | 4.05k Vues
Niches. What is a niche?. Niche Theory. You can think of it as its ‘address’. What is a niche?. A multidimensional expression of where or how a species lives. Niche Theory.

E N D
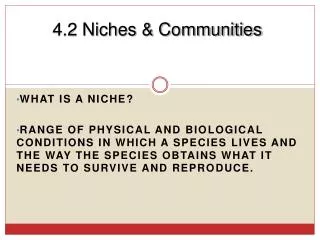
Niches • What is a niche?
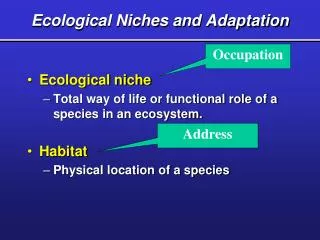
Niche Theory • You can think of it as its ‘address’
What is a niche? • A multidimensional expression of where or how a species lives
Niche Theory • Generalist vs. Specialist
Niche Theory • Why the hump in the curve? • Consequently, they taper off at each end of the resource spectrum becoming less competitive at either end Because there is an optimal ‘size’ or space on the resource continuum
Realized vs. Fundamental • Why might a sp. not completely occupy its fundamental niche?
Niche Breadth • What are some of the factors that impact niche breadth? • Competition • Predation • Resource predictability • Resource abundance • Intraspecific competition (ind. vs. pop)
Niche Theory • Despite its conceptual simplicity, observing niche competition is not so easy • A basic premise, in the presence of a strong competitor, niche breadth should change (short term through behavioral modifications and long term through evolutionary adaptations)
Niche Theory • Huey et al. (1974) demonstrated that 2 sp. of skinks appear to have large dietary overlap of termites when population adjacent, but shift away from one another when sympatric • Furthermore, at the end of sympatric distribution, the smaller sp. quickly displayed a significant increase in body, head, and jaw size
Niche Theory • This dramatic change is frequently associated with character displacement • What is the problem with documenting character displacement?
Niche Theory • We may observe current patterns in an attempt to determine past events • One example is that adaptive radiations and subsequent ‘regular spacing’ on resource axes
Niche Theory However, different size bills and bodies can also simply reflect diet specialization (i.e. just getting better) There are several clusters of similar species that have developed differences in foraging areas and that is an indirect indication that competition may have been at work (previously)
Niche Theory Tyrannid flycatchers; perhaps an example of past competition
Niche Theory Foraging relationship among several antbirds (Formicariidae) showing ecological separation
Niche Theory • Projected niche relationships in 2 resource space
Niche Theory • Ecological segregation should work to minimize competition and niche overlap
What is niche overlap? • Species can be generalists and have relatively high niche overlap and compete strongly with other species
What is niche overlap? • Species can either separate and minimize competition (lower the niche overlap) by becoming a resource specialist (a)
Niche Breadth (width or size) • Some plants and animals are more specialized than others, and measures of niche breadth attempt to quantify this • It is typically measured by observing the distribution of individual organisms within a set of resource states • Information is collected and presented in a resource matrix
Example of a Resource Matrix The percentage utilization of 14 microhabitats by 11 species of SW desert lizards
What are common resource states? • Resource states may be defined in a variety of ways: • 1) Food Resources: taxonomic identity of food taken may be used as a resource state, or the size category of food item (without regard to taxonomy) could be defined as the resource state
What are common resource states? • 2) Habitat Resources: habitats for animals may be defined botanically or from physical-chemical data in a series of resource states • 3) Natural Sampling Units: sampling units like lakes or leaves or individual fruits may be defined as resource states • 4) Artificial Sampling Units: a set of random quadrats may be considered different resource states
Niche Overlap • Shared niche space of the Hutchinsonian multidimensional niche • Thought to represent a measure of competition intensity
Levin’s Measure • Niche breadth be estimated by measuring the uniformity of distribution of individuals among the resource states B = Y2 / ∑ N2j where B = Levins measure of niche breadth Nj = Number of individuals found in or using resource state j Y = ∑ Nj= Total no. of individuals sampled
Shannon-Wiener Measure • Others have suggested using the S-W formula from information theory to measure niche breadth H’ = -∑ pj log pj • This measure tends to weight rare resources (compared to Levin’s, which weights common resources)
Niche and Communities • Community change in the limiting similarity model comes about through repeated colonization and extinction of species with different utilization curves • If adjacent species are ‘too close’ together, one of the pair will go extinct, depending on the overlap and the carrying capacity of the environment (Gause’s competitive exclusion principle)
Niche and Communities • After repeated C & E events, an equilibrium is reached with a maximum number of coexisting species separated by a critical minimum spacing (Gotelli Fig. 4.1)
Niche Overlap • One way to understand community organization is to measure the overlap in resource use among the different species in a community • The most common resources measured in order to calculate overlap are food and space • Several measures have been proposed, with various strengths and weaknesses
Niche Overlap • Historically, analyses of niche overlap were based on the theory of similarity (MacArthur and Levins 1967) • However, this early measure was asymmetrical and has since been replaced by a more symmetrical measure • Overlaps calculated this way have been equated with the competition coefficients of the Lotka-Volterra equations and are thus proportional to the intensity of competition
MacArthur and Levins Overlap ∑ p2i p1i O21 = ∑ (p1i)2 Asymmetrical Competition (impact of sp1 on sp2 is not the same as that of sp2 on sp1)
Pianka’s Overlap ∑ p2i p1i O12 = O21 = √∑ (p2i)2 ∑ (p1i)2
Czekanowski’s Index O12 = O21 = 1 – 0.5 ∑ |p1i – p2i|
Percentage Overlap • This is a very attractive measure as it is relatively easy to calculate and interpret Pjk = [ ∑ (minimum pij, pik)] * 100 where Pjk = percent overlap between j and k pij &pik = proportions resource i is of the total resources used by species j and k and n = total number of resource states
Morisita’s Measure C = 2 ∑ pij * pik / ∑npij[(nij-1)/(Nj-1)] + ∑n pik [(nik-1)/(Nk-1)] This measure is free from bias over a range of possible values and is a relatively good measure of overlap
Null Model Decisions • Weighted vs. Unweighted Indices • If all resources states are not equally available, observed overlaps in utilization may not accurately reflect similarity in use • In particular, if some resource states are extremely common and others are extremely rare, species may appear very similar in their resource utilization
“electivity” • Ecologists have suggested modifying existing indices to account for the electivity, (the relative ability (or preference), of resource use • Incorporating resource availability may have a major effect on measures of overlap (e.g. think about large use; could be abundant resource or high preference)
Weighted vs. Unweighted • If resource states are not equally abundant, observed utilizations will tend to overestimate the amount of ecological overlap (i.e. everyone is using abundant resources) • However, it can also correct for uneven resources • For example, only 2 of 10 mean utilization overlaps for Pianka’s (1967) NA lizard communities differed from null models whereas all 10 mean electivities differed significantly • This approach has problems as well, see book
To generate a null model to test for deviations from expected (for overlaps), we need to construct a null model • We could 1) randomize the dietary or activity data OR 2) randomize species occurrences
Niche Overlap &Species Occurrences • If competition limits niche overlap, then the particular combination of species that coexist on the island should have lower overlap than a randomly assembled set of species from the same source pool (Gotellli and Graves)
Randomization of species occurrences • How to generate a null model for niche overlap of 18 species of lizards on 37 islands in the Sea of Cortez? • Using biologically realistic criteria, Case (1983) identified a source pool of 18 mainland species that could potentially colonize each island • For each island with i species, Case enumerated all the unique (1i8) combinations of exactly i species as null communities
Example Species coexisting on islands had lower niche overlap (30 of 37 times) than would be expected in the absence of competition (or a nonrandom pattern of resource availability)
however, this analysis assumed that species colonized islands equiprobably • When %occupied was used instead, only 23 of 27 fell below the median • This suggests that dispersal ability may have contributed to the pattern of reduced overlap
Wait… • What is low overlap was a result of nonrandom patterns of resource availability on islands? • If the same nonoverlapping sets of resources were present on several islands, the same combinations of low-overlap species would be found
For most island size classes, an improbably small number of species combinations was represented • SO? This suggests the same low-overlap configurations tended to recur. • Consequently, the pattern initially observed probably resulted from a nonrandom distribution of resources and NOTcompetition
Null Model Example • Schoener (1988) also examined niche overlap of island lizard species sampled from a larger source pool, but examined microhabitat use • Coexisting species usually differed in the structural habitats they occupied • e.g. on two-species islands, each species occupied a different category; coexistence in the same habitat was found once on 3-species islands and never on 4-species islands
Null Model Example • He tested four different ‘source pool’ scenarios, varying in the likelihood of occupying habitat categories • Together (Schoener and Case), these studies show results will be sensitive to sample size, source pool definitions, and assumptions about the colonization potential of species…and is a good tool for evaluating niche overlap