Download
1 / 33
330 likes | 528 Vues
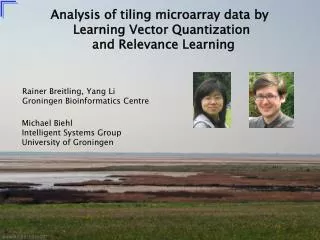
Analysis of tiling microarray data by Learning Vector Quantization and Relevance Learning. Rainer Breitling, Yang Li Groningen Bioinformatics Centre. Michael Biehl Intelligent Systems Group University of Groningen. Learning Vector Quantization .

E N D
Analysis of tiling microarray data by Learning Vector Quantization and Relevance Learning Rainer Breitling, Yang Li Groningen Bioinformatics Centre Michael Biehl Intelligent Systems Group University of Groningen
Learning Vector Quantization • introduction to prototype learning and LVQ • - distance based classification • - basic training prescription: LVQ1 Outline Example: Intron/Exon classification - based on tiling microarray data - application of standard LVQ1 (fixed metric) Adaptive metrics and relevance learning - weighted Euclidean distance, relevance learning - feature weighting, feature selection - adaptive relevance matrices in LVQ Summary / Outlook
often: heuristically motivated variations of competitive learning • initialize prototype vectors for different classes example: basic LVQ scheme “LVQ1” [Kohonen] • present a single example • identify the closest prototype, i.ethe so-calledwinner classification: assignment of a vector to the class of the closest prototype w • move the winner -closertowards the data (same class) -away from the data (different class) Learning Vector Quantization (LVQ) - identification of prototype vectors from labelled example data - parameterization of distance based classification (e.g. Euclidean) aim: generalization ability classificationof novel data after learning from examples
often: heuristically motivated variations of competitive learning • initialize prototype vectors for different classes example: basic LVQ scheme “LVQ1” [Kohonen] • present a single example • identify the closest prototype, i.ethe so-calledwinner classification: assignment of a vector to the class of the closest prototype w • move the winner -closertowards the data (same class) -away from the data (different class) Learning Vector Quantization (LVQ) - identification of prototype vectors from labelled example data - parameterization of distance based classification (e.g. Euclidean) aim: generalization ability classificationof novel data after learning from examples piecewise linear decision boundaries
ℝN set of prototypes nearest prototype classifier representing class based on similarity/distance measure given feature vector ξ, determine the winner → assign ξto class Si* examples: squared Euclidean distance Manhattan distance formally:
sequential presentation of labelled examples … the winner takes it all: ηw : learning rate, step size of update (repulsion/attraction) LVQ1 training: randomized initial wk, e.g. close to the class-conditional means • many variants/modifications: • learning rate schedule ηw (t) • update of more than one prototype • more general update functions Ψ(S,σ,wi*,…)
often based on purely heuristic arguments or cost functions with unclear relation to classification error LVQ algorithms ... • frequently applied in a variety • of practical problems • plausible, intuitive, flexible • fast, easy to implement • natural tool for multi-class problems • limited theoretical understanding of convergence etc. • important issue: which is the ‘right’ distance measure ? Relevance Learning: adaptation of the metrics / distance measure during training here: applied in a (non-standard) classification problem from bioinformatics
Gene expression c/o R. Breitling
perfect match intensities mismatch intensities G A G T C T A G G (PM) G A G T G T A G G (MM) Genomic tiling array data sequence covered by ‘path’ or ‘tiling’ A C T T A C A A G G A G T C T A G G C A … C A T T A C G A C T C. elegans microarray: transcription intensity vs. genomic position repeated for many samples: - different developmental stages - varying external conditions • different strains (variants) • mutants …
21 samples + mutant probe intensities position on genome exons: transcribed → mRNA → translated →protein introns: transcribed → (pre-) mRNA but spliced out before leaving the nucleus, → no translation Wikipedia: non-coding DNA inside a gene c/o R. Breitling, Y. Li (4120) genomic positions, classified asintronic / exonic
21 samples + mutant probe intensities position on genome c/o R. Breitling, Y. Li (4120) genomic positions, classified asintronic / exonic Note: class membership labels according to the current genome annotation, trueintrons / exons are not exactly known! Aim: identify false introns = potential new exons (or even genes) ? 24 features constructed from ‘raw data’ including: median PM and MM probe intensities, correlations of neighboring genome positions, melting temperatures, …
example feature vectors class 1 class 0 feature # 4120 labelled vectors (2587 from class ”0”, 1533 from class ”1” ) 24 features (real numbers), z-transformed:
class conditional mean vectors class 1 class 0 class 1 class 0 all training test 4120 labelled vectors (2587 from class ”0”, 1533 from class ”1” ) 24 features (real numbers), z-transformed: → (Manhattan) distance based classifier evaluation scheme: training from 3000 examples testing on 1000 examples (avg. over >10 random permutations) error rates: feature #
LVQ1 class 1 ccm several prototypes per class ccm ηw=0.01 class 0 • increased complexity • improved performance LVQ1 2+1 test error 3+3 • possible over-fitting (?) • (low training, high test error) • due to highly specialized wi 6+6 epochs LVQ1 training: one prototype per class compared to ccm-prototypes: - LVQ1 exaggerates differences between the classes - here: almost identical performance
2+1 prototypes 1+2 prototypes score score 26% 20% class 1 12% 29% 68% 45% class 0 class 1 class 1 class 0 class 0 all all test (→ place more prototypes in class with greater variability)
Prototypes and scores (6+6 prototypes) 5 % 5 % 4 % class 1 7 % 6 % 5 % 10 % 10 % 12 % class 0 10 % 18 % 7 %
global relevances local relevances global rel. local/class-wise Euclidean class-wise relev. Adaptive Distance Measures – Relevance Learning scaled features, e.g. modified Euclidean (or Manhattan,…) distances:
→ determine winning prototype update winner as in LVQ1 update (global) relevances enforce { { { { large small large small increases decreases decreases increases → λj → λj winner is correct, contribution δj is winner is wrong, contribution δj is - weighting/ranking of features → better performance • elimination of noisy/irrelevant features → reduced complexity insight into the data / classification problem Adaptive Distance Measures – Relevance Learning LVQ-training + adaptation of relevances, e.g. heuristic RLVQ [Bojer, Hammer et al., 2001]
training and test error > 0.15 relevance profile over-simplified classification ( ≠ overfitting) improved performance by weighting and selection of features training and test error ~ 0.115 relevance profile (1+1) prototypes, global relevance learning ηλ=10-4 ηw=10-2 training/test (ccm/LVQ1) epochs successful learning requires ηλ ≪ ηw
training and test error ~ 0.115 relevance profile over-simplified classification improved performance by weighting and selection of features training and test error < 0.11 relevance profile (6+6) prototypes, global relevance learning ηλ=10-5 ηw=10-2 (ccm/LVQ1) training/test
the data revisited: global relevances relevance profile significance of strain and stage effects melting temperature (G-C content) of probe and its neighbors m.m. correlations of probe with neighbors p.m. correlations of probe with neighbors mismatch (m.m) intensities perfect match (p.m.) intensities of the probe itself (3) and of neighboring probes (median over all samples)
relevances relevances class 1 prototypes class 0 relevances (2+1) prototypes, local relevances ηλ=10-5 ηw=10-2 test error epochs
determine the minimum of… →class 0 →class 1 (2+1) prototypes, local relevances relevances ηλ=10-5 ηw=10-2 test error relevances class 1 epochs prototypes very simple classifier: class 0 relevances
class 0 class 1 important for exon identification! the data revisited: local or class-wise relevances significance of strain and stage effects melting temperature (G-C content) of probe and its neighbors m.m. correlations of probe with neighbors p.m. correlations of probe with neighbors mismatch (m.m) intensities perfect match (p.m.) intensities of the probe itself (3) and of neighboring probes (median over all samples)
enforce relevance update: Adaptive Metrics extended: Relevance Matrices [Schneider, Biehl, Hammer, 2007] generalized quadratic distance: Λ takes into account correlations between features Ωadaptive, instantaneous linear transformation of feature space variants: global, class-wise, local relevance matrices
5-dim. subspace eigenvalues Preliminary results: 2+1 prototypes, global relevance matrix diagonal Λii ηΩ=10-6 ηw=10-2 training / test error <“6+6” epochs off-diagonal Λjk
global relevance matrix m.m. correlations p.m. correlations m.m. intensities p.m. intensities melting temp. p-value p.m. intensities m.m. intensities p.m. correlations m.m. correlations melting temp. p-value
2+1 prototypes, class wise relevance matrices class 0 class 1
Summary ( LVQ ) LVQ classifiers + easy to interpret, distance based schemes + parameterized in terms of typical data + natural tool for multi-class problems + suitable for large amounts of data - standard problems of model selection, parameter tuning,… - choice of appropriate metrics Relevance Learning + adapts distance measure while training prototypes + facilitates significant improvement of performance + can simplify the classifier drastically + Matrix RLVQ can take into account correlations - may suffer from over-simplification effects
Outlook ( LVQ ) Relevance Learning - put forward Matrix method, apply in different contexts (→ P. Schneider) - theoretical analysis (dynamics, convergence properties) - regularization (here: early stopping) - feature construction (beyond weighting/selection) - advertise in bioinformatics community e.g. R –implementation of RLVQ (Yang Li, in preparation)
Summary ( biology ) classification of exonic/intronic gene sequences - weighting / selection of features leads to improvement and/or simplification of classifier - plausible results when forced to over-simplify - importance of p.m. correlations for exon identification (novel set of features suggested by Breitling et al. ) Outlook ( biology ) • - systematic study of matrix method (correlations between features) • - extension to whole-genome tiling data (millions of probes!) • different organisms and technological platforms • analysis of raw data before heuristic construction of features • - investigation of false introns
The current “LVQ group” in Groningen Petra SchneiderW. Storteboom Fabio Bracci Piter Pasma Gert-Jan de Vries Caesar Ogole Aree Witoelar M.B. Julius Kidubuka (Kerstin Bunte)