Download
1 / 28
280 likes | 295 Vues
Join us to learn about the data reconciliation processes for 2019 and get a walkthrough of the MVPS Dashboard Case Count view. Visit the NMI Technical Assistance and Training Resource Center for more details.

E N D
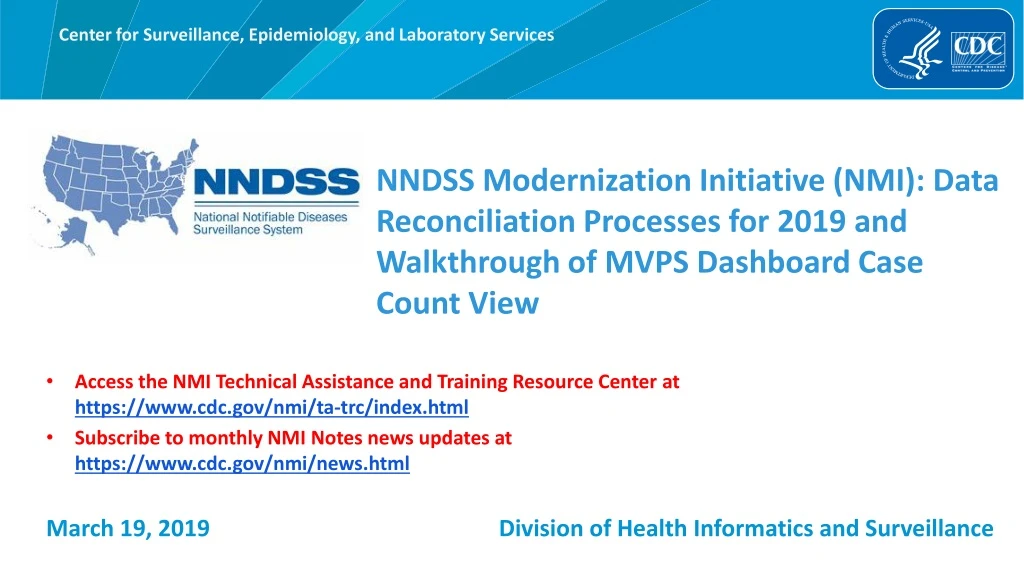
NNDSS Modernization Initiative (NMI): Data Reconciliation Processes for 2019 and Walkthrough of MVPS Dashboard Case Count View Access the NMI Technical Assistance and Training Resource Center at https://www.cdc.gov/nmi/ta-trc/index.html Subscribe to monthly NMI Notes news updates at https://www.cdc.gov/nmi/news.html March 19, 2019 Division of Health Informatics and Surveillance
Agenda • Welcome and Announcements • NNDSS Data Reconciliation Process for 2019 • Deborah Adams, CDC • Yvette Dominique, CDC • Walkthrough of MVPS Dashboard Case Count View • Andrew Kuehl, CDC • Questions and Answers
Announcements • The Epidemiology Laboratory and Capacity (ELC) FY2019 NOFO is now posted on Grants.gov! • Similar to last year, template resources are available within the REDCap ELC Application and Monitoring Portal for 2019-2020. • Applicants should submit their completed FY2019 ELC NOFO Application via Grants.gov and upload a courtesy copy to REDCapby Friday, May 10, 2019 at 11:59 PM EST.
NMI Updates and Timeline Lesliann Helmus, MSPH, CHTS-CP Associate Director for Surveillance Michele Hoover, MS Lead, State Implementation and Technical Assistance
NMI Implementation Status March 19, 2019 NH WA VT ME AK ND MT MN MA OR NY WI RI ID SD MI CT WY PA NYC NJ IA OH CA NE DE IN NV HI IL WV MD UT VA DC MO CO KS KY NC TN SC OK AR NM AZ MS AL GA LA TX PR FL Onboarding Total of 7 (states) Production Total of 34 (33 states + NYC) Piloting Total of 1 (state)
Piloting Status 03/19/19
Preparing to Reconcile 2018 Data Deborah A. Adams Yvette Dominique, MS, PMP Center for Surveillance, Epidemiology and Laboratory Services Centers for Disease Control and Prevention
What is NNDSS Reconciliation? • Process to finalize case counts for the previous year • Agreement between reporting jurisdiction database and CDC NNDSS database • CDC provides tables with counts to be printed in the NNDSS tables • Based on surveillance case definitions, case status classifications, print criteria • Reconciliation packet includes • Summary Production Calendar • week-ending calendar • reconciliation tables with instructions for use • detailed listing of all non-STD cases • Final steps: State or territory epidemiologist signs-off on final counts
Lessons Learned Conference Calls • Conducted in December 2018 • Identified process improvements for NNDSS annual data reconciliation activities and operations • Included eight reporting jurisdictions • Arkansas • California • District of Columbia • Louisiana • Missouri • Oklahoma • Texas • Virginia
Recommendations • Health Jurisdictions: • Start close-out process with local health departments sooner • Assign a point person to coordinate NNDSS reconciliation • Data Operations: • Provide reconciliation tables more than once a year (e.g., quarterly or biannually) • Incorporate additional data elements to facilitate local follow-up • Periodically send reminders during reconciliation • Hold webinar to review timeline and share helpful information
Recommendations (cont’d) • MVPS: • Enhance information available on Dashboard to help with reconciliation (e.g., counts of messages sent, diseases and conditions, etc.) • CDC programs: • Increase communications between programs and jurisdictions throughout the year • Quarterly reports help identify missing cases and quality issues sooner • Validate/update disease-specific points-of-contact for jurisdictions • Quick responses are appreciated • Data transmission: • Closer tracking of large transmissions • CDC overall: • Provide jurisdictions with more/real-time access to data sent to CDC • Quick responses to questions about data and numbers are very helpful
2018 Reconciliation Tables forNational Notifiable Infectious Diseases Table 1 State-specific case count by system status and disease Table 2 State-specific case count by case status classification and disease Table 3 State-specific case count by month and disease Table 4 State-specific case count by race/ethnicity and disease Table 5 State-specific case count by age group (years) and disease Table 6 State-specific case count by sex and disease Table 7 State-specific case count by MMWR week and disease Table 8 State-specific case count by Reporting county and disease Table 9 State-specific case count by MVPS ‘County of residence’ PID-11.9 (NEW) Table 10 State-specific outbreak status by disease Table 11 State-specific import status by disease Table 12 State-specific case count by disease and reporting exception [diseases that are ‘Not Reportable’ or where data are ‘Unavailable’] (NEW) Table 13 State-specific case count for retired event codes (NEW) Line List State-specific case-level line list for non-STD data by disease (includes original NBS & HL7 case ids) Excel Workbook Tables 1-11 in machine-readable format
TABLE 8: STATE-SPECIFIC CASE COUNT BY REPORTING COUNTY AND DISEASE
TABLE 9: STATE-SPECIFIC CASE COUNT BY COUNTY OF RESIDENCE AND DISEASE
TABLE 12: STATE-SPECIFIC CASE COUNT BY DISEASE AND REPORTING EXCEPTION Information on notifiable conditions that are not reportable or do not have data available for the jurisdiction.
TABLE 13: STATE-SPECIFIC CASE COUNT FOR RETIRED EVENT CODES BY DISEASE Please update your system to use 2018 event codes for 2018 data.
Reconciliation Tips • Have an assigned point person and communicate that to your state support representative on the NNDSS Data Operations Team (DOT). • Start the process early . • Check to make sure your digital PHINMS certificate and/or your PHINMS software is up to date. • You may request a detailed line list at any time.
2018 Summary Production CalendarNational Notifiable Infectious Disease Tables 01/31/2019HIV Diagnoses database closed 02/22/2019 Data Coordinator emails State/Territorial Epidemiologist letter with production calendar 02/22/2019 Influenza-associated pediatric mortality database closed 02/22/2019 Novel Influenza A Virus database closed 03/01/2019 Deadline: State/Territorial Epidemiologists respond to letter and timeline 03/18/2019 Data Operations Team (DOT) begins e-mailing reconciliation packets to State/Territorial Reporters 03/28/2019 Webinar on 2018 Reconciliation process with state/territorial reporters 04/26/2019 STD database closed 05/31/2019 Rabies database closed 05/07/2019 Last day for States/Territories to transmit 2018 data as part of their weeklyNETSS files 05/31/2019 HIV Diagnoses database closed 05/31/2019 Varicella morbidity and mortality database closed 05/31/2019 Last day for States/Territories to transmit 2018 FINAL year-to-date data files and updates 06/10/2019 DOT begins e-mailing FINALreports to State/Territorial Epidemiologist for FINALsignature 06/30/2019 Deadline: State/TerritorialEpidemiologists’ last day to return FINALsignature reports 06/30/2019 TB database closed 06/30/2019 ARBONET database closed 06/30/2019 NNDSS 2018 Reconciliation database CLOSED 10/31/2019 Publish the FINAL 2018 Nationally Notifiable Infectious Diseases tables on CDC WONDER
MVPS Dashboard Case Count View Andrew Kuehl, MIT, PMP MVPS Project Lead
Case Counts: Logic Associated With Case Processing Status and Case Classification Status Values t
MVPS Case Counts—Case Overview Tab: Mockup Snapshot Reflecting Design Revisions* REVISIONS as of 3/11/2019 Please note, this mockup snapshot intends to reflect current proof-of-concept design, based on iterative requirements/design discussions. The following aspects shown on this mockup snapshot are notreflected on the working InVision mockup (https://projects.invisionapp.com/share/52Q5NVKA8N6#/screens). • Table values align with expected column logic (as described on the Case Counts Logic slide) • Case Classification Status column ordering reflects logical case progression • Total column moved from the Case Processing Status section • Errored column added to the Case Classification Status section
Subscribe to monthly NMI Notes news updates athttps://www.cdc.gov/nmi/news.html Access the NMI Technical Assistance and Training Resource Center at https://www.cdc.gov/nmi/ta-trc/index.html Request NMI technical assistance or onboarding at edx@cdc.gov Next NMI eSHARE is April 16, 2019 – details at https://www.cdc.gov/nmi/eshare.html