Download
1 / 26
260 likes | 517 Vues
Latino/a Demographic and Ed. Trends. Source: Various U.S. Bureau of the Census & NCES tables. Educational Attainment by Latino Origin, U.S. 2002. (Population 25 years and over). Percent. Status dropout rates by Generation in U.S. for Latinos and non-Latinos, 1999.

E N D
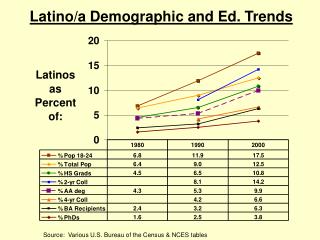
Latino/a Demographic and Ed. Trends Source: Various U.S. Bureau of the Census & NCES tables
Educational Attainment by Latino Origin, U.S. 2002 (Population 25 years and over) Percent
Status dropout rates by Generation in U.S. for Latinos and non-Latinos, 1999 Source: NCES http://nces.ed.gov/pubs2001/dropout/StatusRates3.asp
Percent of Population with Less than 9th Grade Completed by Latino Origin: 2002 (Population25 years and over) Percent SOURCE: U.S. Census Bureau, Current Population Survey, March 2002, Ethnic and Hispanic Statistics Branch
Percent of Populationwitha Bachelor’s Degree or Higher by Hispanic Origin: 2002 (Population 25 years and over) Percent SOURCE: U.S. Census Bureau, Current Population Survey, March 2002, Ethnic and Hispanic Statistics Branch
Distribution of Latinos by Type: 2000 Source: Census 2000 SF1
National Origin Distribution of Latino/a Population and Latino/a Professors, U.S. 2000 Source: J. Chapa, 2005. “Preparing a Future Professorate to Successfully Teach California’s and the Nation’s Latino and African American Students.” in Gandara, P., Horn, C., & Orfield, G. (eds.), Expanding Opportunity in Higher Education. New York: SUNY Press, 2005.
Population less than age 18 and all ages as % of U.S. total population Source: U.S. Bureau of the Census, 2000
Distribution of Latino & Anglo Family Incomes, U.S., 2000 Source: U.S. Bureau of the Census, SF3, http://factfinder.census.gov
Poverty Levels for Latino, Non-Latino and Latino Groups, 2002 U.S. Census 2002 Current Population Survey
Projections of College-Age Latino/a Population, U.S. 2000-2040 College-Age % of all 18-24 Latinos year olds 2000 3,679,000 ~18% 2020 5,981,000 ~25% 2030 7,330,000 ~29% 2040 8,895,000 ~33% Source: U.S. Census Bureau, 2004, "U.S. Interim Projections by Age, Sex, Race, and Hispanic Origin," <http://www.census.gov/ipc/www/usinterimproj/> Internet Release Date: March 18, 2004
College-Age Latino/a Enrollments, U.S., 2000-2040 Projected Latino Projected Latino Enrollments Enrollments at Current at Current NL Latino Rate (.21) White Rates (.393) 2000 772,590 1,445,847 2020 1,256,010 2,350,533 2030 1,539,300 2,880,690 2040 1,867,950 3,495,735
College-Age Latino/a Degree Attainment U.S., 2000-2040 Projected Latino Projected Latino Degrees Degrees at at Current Latino Current NL Rate (.060) White Rate (.133) 2000 221,844 487,835 2020 360,654 793,081 2030 441,999 971,958 2040 536,369 1,179,477
Wealthy Fill Top Colleges! “Over all, at the 42 most selective state universities, including the flagship campuses in California, Colorado, Illinois, Michigan and New York, 40 percent of this year's freshmen come from families making more than $100,000, up from about 32 percent in 1999, according to the Higher Education Research Institute. Nationwide, fewer than 20 percent of families make that much money. “As Wealthy Fill Top Colleges, New Efforts to Level the Field” NYT 4-22-04 By DAVID LEONHARDT
The Top Ten Percent Plan (TTPP) at UT Austin -- Background • In response to Hopwood, House Bill 588 passed in 1997 required all TX public universities to admit all students who graduate in the top 10% of their high school class. • Prior to HB 588 a small percentage of TX high schools from wealthy areas dominated the UT applicant pool and freshman class.
Top 10% vs. Test Scores “[T]op 10 percent students at every level of the SAT earn grade point averages that exceed those of non-top 10 percent students having SAT scores that are 200 to 300 points higher. Strong academic performance in high school is an even better predictor of success in college than standardized test scores.” Dr. Larry Faulkner, President, UT Austin, 1998-2006
UT Austin Top 10% --Findings • TTPP students have lower SAT scores but better grades and higher retention rates than non- top 10% students. This includes students who would have previously been rejected. • TTP has restored previous URM levels • More economic and geographic diversity • Proactive recruitment is important
Top 10% at UT Austin Because TTPP are better prepared, UT has been able to cut remedial courses and increase honors sections. Non-TTPP students are still admitted. Knowledge about TTPP has “significantly influenced college intentions and the likelihood of actual enrollment in a four-year institution. Students who knew a lot about TTPP were more than five times as likely to enroll in a four year institution as the comparable student who did not know about the law.
California’s Top 4% Plan --Eligibility in the Local Context (ELC) ELC will admit relatively few new students. It has added about 3,600 students to the eligibility pool but it has also encouraged the many other potentially eligible students to complete the required coursework and to apply to UC. The biggest impact of ELC lies in its impact as a very effective means of recruiting applicants.
The Problem with Scores • Test scores are very often used inappropriately and perniciously. They are given a reliability, validity and significance beyond their technical capacity. • The use of test scores has a disparate impact and significantly decreases the proportion of minorities. • Test scores are highly correlated with socio-economic status and access to selective public higher education has become the prerogative of privileged students from wealthy homes.
Chicago ENLACE Partnership (CEP) • ENLACE (Engaging Latino Communities in Education) was a multi-year national initiative funded by the WK Kellogg Foundation with the goal of increasing Latino success in college. • The Chicago-area ENLACE was based at NEIU. • CEP organized hundreds of outreach events with thousands of participants. • CEP emphasized leadership, mentoring and community involvement. • CEP resulted in increased Latino recruitment, retention, transfer and graduation rates in programs ranging from AA degrees to MA degrees. • More research need to be done.
Alternative Rankings Proposed Current rankings reward colleges that enroll highly prepared, wealthy students who are most likely to graduate on time. But a system that compared predicted and actual retention and graduation rates — based on socioeconomic and other data — would give high marks to colleges with great track records on educating disadvantaged students, even if those rates were lower than those of some colleges that focus only on top students. http://www.educationsector.org/usr_doc/CollegeRankingsReformed.pdf