Download
1 / 7
70 likes | 77 Vues
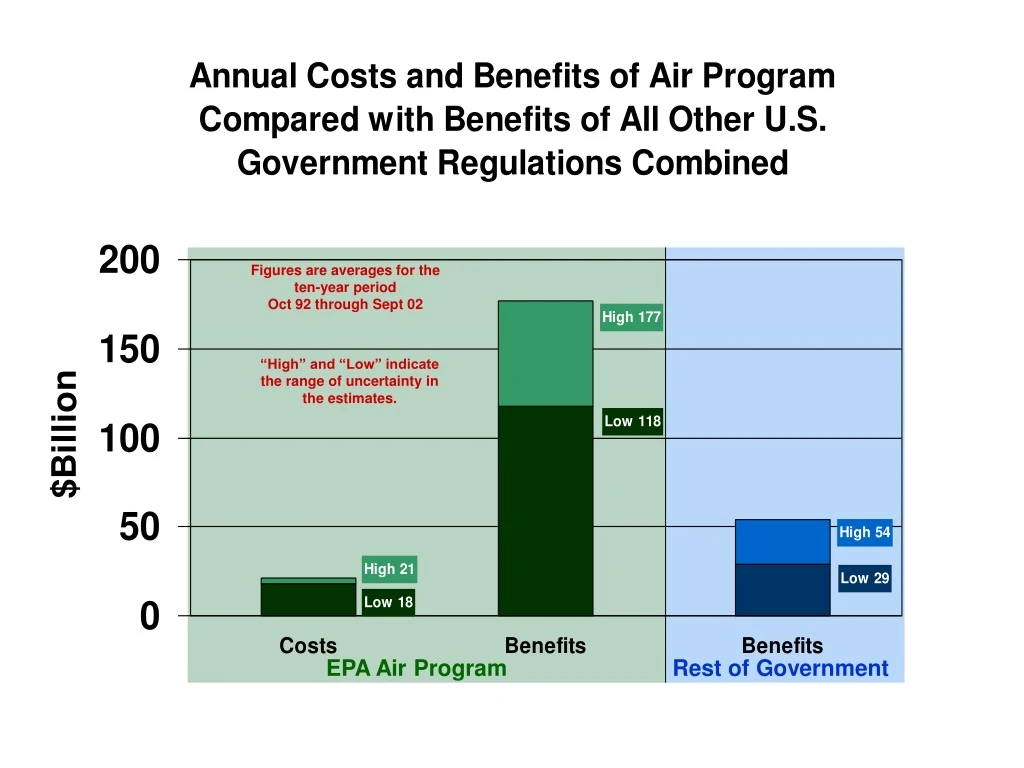
This report provides estimates of the impact of the EPA Air Program on reducing the incidence of health effects caused by passenger car NOx and power plant SO2 emissions. The figures represent ten-year averages from October 1992 to September 2002, with "High" and "Low" indicating the range of uncertainty in the estimates. The projections for SO2 emissions are based on data from the National Air Pollutant Emissions Trend Report and the Integrated Planning Model. The Clean Air Interstate Rule and other clean air programs have resulted in cleaner air in 317 Eastern counties exceeding standards in 2002, with 39 remaining Eastern counties likely to meet standards by 2015. The report also highlights the status of Ozone (O3) and PM2.5 standards in various counties.

E N D
Figures are averages for the ten-year periodOct 92 through Sept 02 “High” and “Low” indicate the range of uncertainty in the estimates. EPA Air Program Rest of Government
812 Prospective I Health Effect2010 Title I - V Incidence Reductions
SO2 Reductions from Power plants Sources: 1990 - 1999 emissions data are from the National Air Pollutant Emissions Trend Report (EPA, March 2000). Projections for SO2 are derived from the Integrated Planning Model (IPM). The 2010 to 2020 projection follows EIA’s assumptions in AEO 2001 of 3% growth per year.
Clean Air Interstate Rule, with Other Clean Air Programs, Brings Cleaner Air 317 Eastern Counties Exceeding Standards in 2002 39 Remaining Eastern Counties Likely to Exceed Standards with Clean Air Interstate Rule in 2015 O3 Only ( 218 Counties) O3 Only ( 26 Counties) PM2.5 standard = 15 µg/m3 8-hour Ozone Standard = .08 ppm PM2.5 Only ( 43 Counties) PM2.5 Only ( 13 Counties) Both O3 & PM2.5 ( 56 Counties) Both O3 & PM2.5 ( 0 Counties)
CAAAC’s Rapid Response Team Carey Fitzmaurice 202 564 1667 fitzmaurice.carey@epa.gov