Download

1 / 19
220 likes | 374 Vues
CHAPTER 17 Financial Planning and Forecasting. Forecasting sales Projecting the assets and internally generated funds Projecting outside funds needed Deciding how to raise funds. Balance sheet (2002), in millions of dollars. Cash & sec. $ 20 Accts. pay. & accruals $ 100

E N D
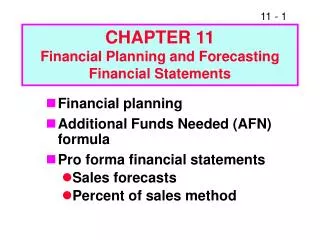
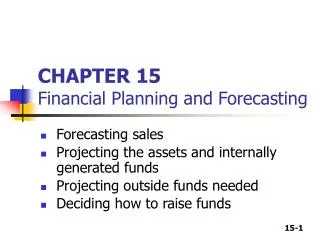
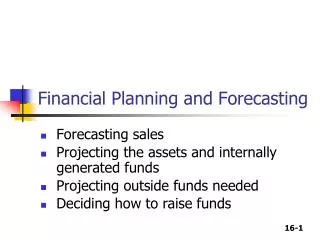
CHAPTER 17Financial Planning and Forecasting Forecasting sales Projecting the assets and internally generated funds Projecting outside funds needed Deciding how to raise funds
Balance sheet (2002),in millions of dollars Cash & sec. $ 20 Accts. pay. & accruals $ 100 Accounts rec. 240 Notes payable 100 Inventories 240 Total CL $ 200 Total CA $ 500 L-T debt 100 Common stock 500 Net fixed Retained assets 500 earnings 200 Total assets $1,000 Total claims $1,000
Income statement (2002),in millions of dollars Sales $2,000.00 Less: Var. costs (60%) 1,200.00 Fixed costs 700.00 EBIT $ 100.00 Interest 16.00 EBT $ 84.00 Taxes (40%) 33.60 Net income $ 50.40 Dividends (30%) $15.12 Add’n to RE $35.28
Key assumptions • Operating at full capacity in 2002. • Each type of asset grows proportionally with sales. • Payables and accruals grow proportionally with sales. • 2002 profit margin (2.52%) and payout (30%) will be maintained. • Sales are expected to increase by $500 million. (%DS = 25%)
Determining additional funds needed, using the AFN equation AFN = (A*/S0)ΔS – (L*/S0) ΔS – M(S1)(RR) = ($1,000/$2,000)($500) – ($100/$2,000)($500) – 0.0252($2,500)(0.7) = $180.9 million.
How shall AFN be raised? • The payout ratio will remain at 30 percent (d = 30%; RR = 70%). • No new common stock will be issued. • Any external funds needed will be raised as debt, 50% notes payable and 50% L-T debt.
Forecasted Income Statement (2003) 2002 Forecast Basis 2003 Forecast Sales $2,000 1.25 $2,500 Less: VC 1,200 0.60 1,500 FC 700 0.35 875 EBIT $ 100 $ 125 Interest 16 16 EBT $ 84 $ 109 Taxes (40%) 34 44 Net income $ 50 $ 65 Div. (30%) $15 $19 Add’n to RE $35 $46
Forecasted Balance Sheet (2003)Assets Forecast Basis 2003 1st Pass 2002 Cash $ 20 0.01 $ 25 Accts. rec. 240 0.12 300 Inventories 240 0.12 300 Total CA $ 500 $ 625 Net FA 500 0.25 625 Total assets $1,000 $1,250
Forecasted Balance Sheet (2003)Liabilities and Equity Forecast Basis 2003 1st Pass 2002 AP/accruals $ 100 0.05 $ 125 Notes payable 100 100 Total CL $ 200 $ 225 L-T debt 100 100 Common stk. 500 500 Ret.earnings 200 +46* 246 Total claims $1,000 $1,071 * From income statement.
What is the additional financing needed (AFN)? • Required increase in assets = $ 250 • Spontaneous increase in liab. = $ 25 • Increase in retained earnings = $ 46 • Total AFN = $ 179 NWC must have the assets to generate forecasted sales. The balance sheet must balance, so we must raise $179 million externally.
How will the AFN be financed? • Additional N/P • 0.5 ($179) = $89.50 • Additional L-T debt • 0.5 ($179) = $89.50 • But this financing will add to interest expense, which will lower NI and retained earnings. We will generally ignore financing feedbacks.
Forecasted Balance Sheet (2003)Assets – 2nd pass 2003 1st Pass 2003 2nd Pass AFN Cash $ 25 - $ 25 Accts. rec. 300 - 300 Inventories 300 - 300 Total CA $ 625 $ 625 Net FA 625 - 625 Total assets $1,250 $1,250
Forecasted Balance Sheet (2003)Liabilities and Equity – 2nd pass 2003 1st Pass 2003 2nd Pass AFN AP/accruals $ 125 - $ 125 Notes payable 100 +89.5 190 Total CL $ 225 $ 315 L-T debt 100 +89.5 189 Common stk. 500 - 500 Ret.earnings 246 - 246 Total claims $1,071 $1,250 * From income statement.
Why do the AFN equation and financial statement method have different results? • Equation method assumes a constant profit margin, a constant dividend payout, and a constant capital structure. • Financial statement method is more flexible. More important, it allows different items to grow at different rates.
Suppose fixed assets had only been operating at 75% of capacity in 2002 • Additional sales could be supported with the existing level of assets. • The maximum amount of sales that can be supported by the current level of assets is: • Capacity sales = Actual sales / % of capacity = $2,000 / 0.75 = $2,667 • Since this is less than 2003 forecasted sales, no additional assets are needed.
How would the excess capacity situation affect the 2003 AFN? • The projected increase in fixed assets was $125, the AFN would decrease by $125. • Since no new fixed assets will be needed, AFN will fall by $125, to • AFN = $179 – $125 = $54.
If sales increased to $3,000 instead, what would be the fixed asset requirement? • Target ratio = FA / Capacity sales = $500 / $2,667 = 18.75% • Have enough FA for sales up to $2,667, but need FA for another $333 of sales • ΔFA = 0.1875 ($333) = $62.4
How is NWC managing its receivables and inventories? • DSO is higher than the industry average, and inventory turnover is lower than the industry average. • Improvements here would lower current assets, reduce capital requirements, and further improve profitability and other ratios.
How would the following items affect the AFN? • Higher dividend payout ratio? • Increase AFN: Less retained earnings. • Higher profit margin? • Decrease AFN: Higher profits, more retained earnings. • Higher capital intensity ratio? • Increase AFN: Need more assets for given sales. • Pay suppliers in 60 days, rather than 30 days? • Decrease AFN: Trade creditors supply more capital (i.e., L*/S0 increases).