Hemoglobin Levels as Key Nutritional Indicator for Educational Achievement in Rural Ugandan Children
This study investigates the relationship between nutritional status, particularly hemoglobin levels, and academic achievement among schoolchildren in rural Uganda. Targeting children in public mixed day schools, the cross-sectional analysis highlights the prevalence of malnutrition, anemia, and deficiencies in micronutrients like iron and vitamin A. The findings indicate that significant proportions of children face stunting, underweight, and anemia, correlating with poor academic performance. Results advocate for integrated health and education strategies to enhance learning outcomes.


Hemoglobin Levels as Key Nutritional Indicator for Educational Achievement in Rural Ugandan Children
E N D
Presentation Transcript
Hemoglobin Status Is The Best Nutritional Variable That Predicts Achievement Among Schoolchildren In Rural UgandaHedwig Acham, Joyce K. Kikafunda, ThorkildTylleskar & Marian K. Malde
The school-age group Background • Corresponds to a period from primary one through lower secondary school • Lumping them together, makes them a neglected group compared to pre-school children, yet at primary one (6 years), children are transitioning from pre-school age (a period of high mortality). School children
Enrolment figures 1997-2003 for Uganda • Due to child survival programs • Most children are surviving to school age today • Increased numbers enroll into primary school • More marginal populations access education
Unfortunately, in the health sector the major focus of health programmes - reducing mortality in infants and very young children. • While in the education sector; • Teaching and learning resources • School infrastructure • Institutional management • Levinger (1994)- Active Learning Capacity (ALC Model) – Mitigates
Active Learning Capacity Framework • Primary variables • Health and nutritional status • Psychosocial support • Hunger level • Secondary variables • Prior learning experience • Learning receptiveness • Aptitude
School child spends 75 % of his total time in the school environment where; • Inadequate safe water supply • Poor latrine coverage • Absence of medical and dental care • Absence of feeding programmes. Uganda
No study had assessed health and nutrition among school children to relate it to academic achievement in Uganda. • Kumi particularly- poor education outcomes (2002-2005). • Evidence: Quality enhancement initiative project (MOES) Problem Statement
To determine the association between nutritional status with academic achievement Aim/Objective
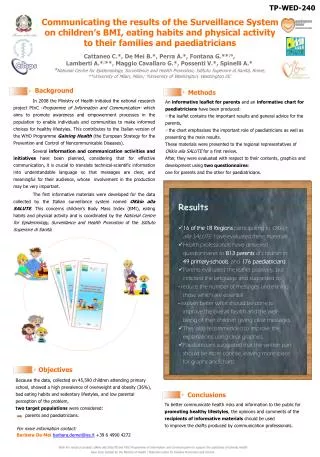
Study Design, Materials And Methods Cross-sectional study design Schools involved- public/ gov’t, mixed day schools. School sampling- modification of cluster sampling (30x30). Class selected – P.4. Child selection- randomized sampling Number involved for this objective (n=145).
Figure 2. A profile of sampling procedure used. The children being discussed in this paper are those highlighted (n=145).
Variables of study 1. Variables of Anthropometry Height Weight
2. Micronutrient variables • Iron status • hemoglobin (characterized anemia) • serum ferritin (characterized iron dfeiciency) Anemia was defined as Hb<12.0 mg/dl, Iron deficiency as sef <15.0µg/L. Blood collection and preparation
Iodine status semi qualitative method (UROJOD test-kit, 3.01299.0001 UROJOD, Germany).
Vitamin A status • modification of high perfomance liquid chromatography (LC-MS assay principal ), on dried blood spots. VAD defined as SeR<0.70µmol/L 4.Learning Assessments (non-standardized) • Teaching/assessing (English and Mathematics) • Life skills Assessments • Oral comprehension
Control of variables/ modifiers of learning • Teacher quality • Methods of measurement and testing • Time of the day • Hunger level • Days of the week • Interschool variability • Age & sex
Scale of measurement of academic achievement LevelsMark range (%) V. Good/ Excellent 80-100 Good 60-79 Fair 31-59 Poor/ weak 0-30 • ______ • Source: MOES
Socio-demographic factors • Household wealth • School attendance rates Other Factors Studied
Data analysis Use of Epiinfo (derive nutritional indices) SPSS (multivariate regression tests level at which results were considered significant (<0.05)
Results • Prevalence rates indicated; • Thinness (11.8%) • Stunting (8.9%) • Underweight (14.4%) • Anemia (24.1%) • Iron deficiency (16.6%) • VAD (30.3%) • Iodine deficiency (3.4%) • More boys were significantly thinner, underweight and stunted than girls (p<0.05). • The reverse was true for anemia, VAD and iodine status.
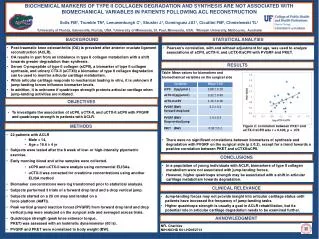
Normal 120.0 40 30 FEMALE Frequency 20 10 0 SEX 120.0 40 30 MALE 20 10 0 0.00 50.00 100.00 150.00 200.00 250.00 300.00 GRAND TOTAL Figure 4. Gender differences in achievement (n=645). Results of academic achievement revealed that; • The best performed subject was oral comprehension (47.66±31.03), worst mathematics (12.53±7.80). • A strong positive correlation between all subjects tested (p<0.01). • T-test showed no gender differences in achievement (p>0.05). • Over all, 68.4% scored below cut off for good achievement (66.7% boys, 69.8% girls).
***. P<0.001; **. p<0.01, *. P<0.05, R2= .17 (Cox & Snell), .23 (Nagelkerke). Model X2 (6) = 87.56 Dependent variable –total score (1 if < 120.0 points). Variables entered on step 1: Mothers education; Variables entered on step 2: Attendance rate; Variables entered on step 3: Feeding Table 2. Stepwise logistic regression model of association between anthropometric variables with academic achievement, with other variables included (n=645)
Dependent variable: Total score (1 if <120.0 points). Variables entered on final step: Household size, age category, mother’s education, wealth, feeding, land quantity, attendance rates, and household head. • R2= .20 (Cox & Snell), .27 (Nagelkerke). Model X2 (14) = 23.10 Table 3. Model between micronutrient variables and achievement, with anthropometric and other variables included (n=145)
Although not significant, there is an association between nutritional status and achievement among children in rural Uganda (Kumi district). • Hemoglobin status seems to be a better predictor of achievement compared to the other nutritional variables. • Recommendations: • More comprehensive research (Ltd data) • Efforts to fight under nutrition (SHN programmes) should be strengthened (include malaria prevention) • Time to focus on achievement (regularly testing them). • A time to re-think school feeding • Thematic curriculum a big snag!!!! Conclusions and recommendations
Carnegie cooperation of New York Norwegian support (NUFU) Fanta-2 Thank you all. Acknowledgement: