Download
1 / 16
160 likes | 163 Vues
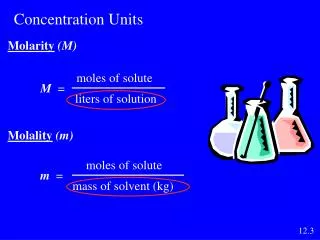
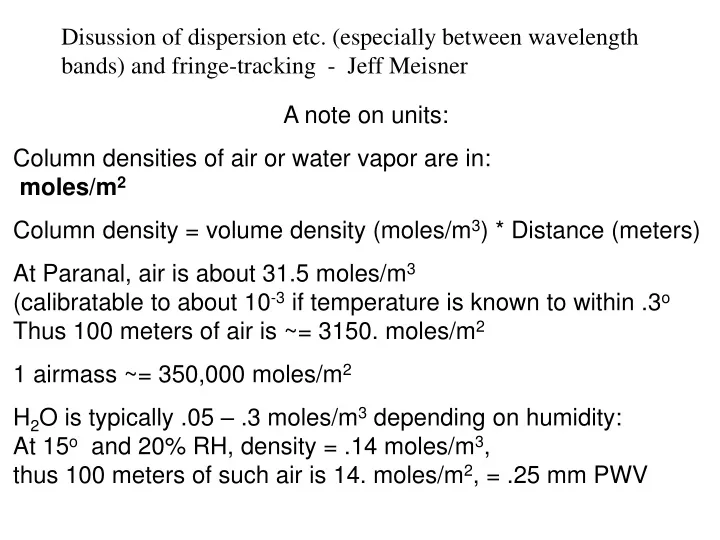
Disussion of dispersion etc. (especially between wavelength bands) and fringe-tracking - Jeff Meisner. A note on units: Column densities of air or water vapor are in: moles/m 2 Column density = volume density (moles/m 3 ) * Distance (meters)

E N D
Disussion of dispersion etc. (especially between wavelength bands) and fringe-tracking - Jeff Meisner A note on units: Column densities of air or water vapor are in: moles/m2 Column density = volume density (moles/m3) * Distance (meters) At Paranal, air is about 31.5 moles/m3(calibratable to about 10-3 if temperature is known to within .3oThus 100 meters of air is ~= 3150. moles/m2 1 airmass ~= 350,000 moles/m2 H2O is typically .05 – .3 moles/m3 depending on humidity:At 15o and 20% RH, density = .14 moles/m3, thus 100 meters of such air is 14. moles/m2, = .25 mm PWV
Achromatic differential delay • Phase delay same for all optical frequencies • Phase at each frequency:f = 2p n t(where t is phase delay)
Non-achromatic delay from water vapor exhibiting First Order Dispersion • Phase delay at each optical frequency proportional to refractivity at that wavelength
Non-achromatic delay from water vapor exhibiting First Order Dispersion • Viewed at phase of center frequency, envelope (“group delay”) shifts w/r/t phase
Non-achromatic delay from water vapor exhibiting First Order Dispersion • Tracking the “group delay” we see the fringe phase go from 0 to 2p and repeat!
MIDI observation, tracking atmospheric (?) OPD and water vapor
Matching of dispersion variations in N-band vs. optical frequency with theoretical curve (from Richard Mathar)(2 free parameters fitted: offset & scale) SNR
Refractive index of water vapor (Computed by Richard Mathar)
Dispersive effect between (and within) bands due to 0 – 600 mole/m^2 of additional dry air. (= 20 meter delay-line offset)Note that dispersion from dry air increases rapidly at short wavelengths (Tracking at the group-delay in K band)
Fitting first order dispersion due to dry air vs. differential delay-line air column (from VINCI)Residuals from fit place upper limit on atmospheric water-vapor at low temporal frequencies (< .01 Hz since ~100 second observations) of < .3 mole/m^2 fD 4p 2p 0 …. Delay line offset, meters-8 -6 -4 -2 0 2
Now, Water Vapor dispersion(Gets worse at longer wavelengths)Recall that atmospheric fluctuations are around .5 – 1 moles/m2 rms
Phase referencing at K band, phase error at other wavelengths due to 1 mole/m^2 of differential water vapor:Is worst at long N band (22 THz)
Water Vapor dispersion, with phase-tracking at K band0 – 5 moles/m^2 (typical p-p value due to atmosphere)
Water Vapor dispersion, with phase-tracking at K band0 – 5 moles/m^2 (typical p-p value due to atmosphere)