Download
1 / 22
220 likes | 263 Vues
This project focuses on validating the design, debugging the simulation program, constructing the detector, and studying the calibration methods for the prototype of the Daya Bay Neutrino Detector. It includes the use of low-background PMTs, reflectors, and different zones for the LS, gamma catcher, and buffer.

E N D
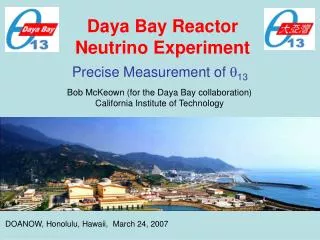
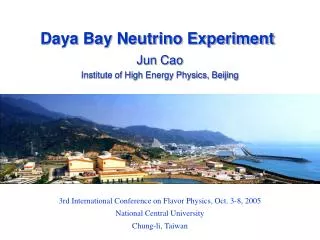
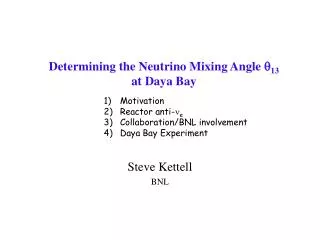
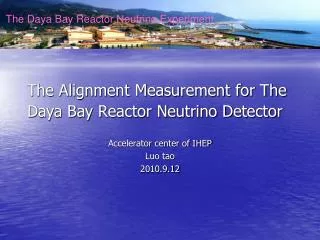
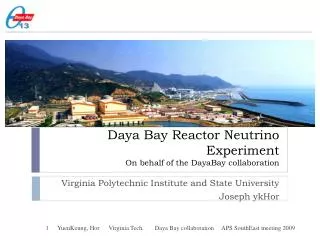
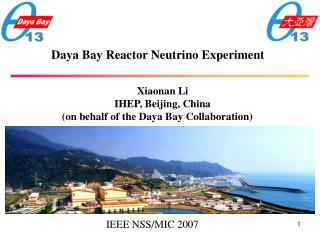
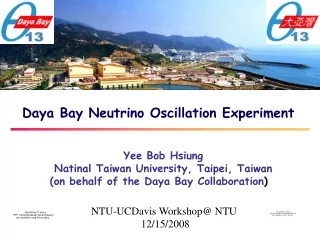
Prototype of the Daya Bay Neutrino Detector Wang Zhimin IHEP, Daya Bay
Far site 1615 m from Ling Ao 1985 m from Daya Overburden: 350 m Daya Bay Near site 363 m from Daya Bay Overburden: 98 m 4 x 20 tons target mass at far site Ling Ao Near site ~500 m from Ling Ao Overburden: 112 m 900 m Ling Ao-ll NPP (under construction) 22.9 GW in 2010 465 m Water hall Construction tunnel 810 m Ling Ao NPP, 22.9 GW Filling hall entrance 295 m Daya Bay NPP, 22.9 GW Total length: ~3100 m Daya Bay
Daya Bay neutrino detector • Low-background 8” PMTs: 192 • Top and bottom reflectors • Three concentric zones: • Target: 20 t (0.1% Gd LAB-based LS) • Gamma catcher: 20 t (LAB-based LS) • Buffer : 40 t (mineral oil) Daya Bay
2-zone IHEP Prototype of the Daya Bay Neutrino Detector • Validate the Daya Bay detector design; • Debug the Geant4 simulation program; • Practice the construction of detector and calibration methods; • Study LS and GdLS Acrylic vessel with 0.9m diameter and 1m height dipped in a stainless steel tank with 2m diameter and height filled with mineral oil; 45 8” PMTs with reflecting at top and bottom; • Two stages: • Phase I (normal LS ) (2005.01 ~2006.11) • Phase II (Gd-loaded LS) (2007.02 ~Now) Daya Bay
This is theinside view of prototype after installation of PMT and acrylic vessel, and LS filling. Daya Bay
Muon veto system This prototype is surrounded by a cubic muon veto detector with five sides (except the bottom). The photographs show the prototype, the rack to support the muon veto (left) and the mounted scintillator counters (right). Daya Bay
Phase I With normal LS:30% mesitylene, 70% mineral oil, 5 g/L BBO and 10 mg/L bis-MSB Daya Bay
Calibration of PMT gain The dark noise rates of most of used PMTs with a peak-to-valley ratio larger than 1.5 are less than 5 kHz at 1/3 P.E. threshold. We calibrate the PMT gain with LED and a convoluted function based on NIM A339 (1994) 468-476. The average PMT gain is ~5.5 ADC bin of SPE (~3.5×10⁷). where: Daya Bay
Phase I Monte Carlo simulation with Geant4 We simulate the energy response of the prototype with a Monte Carlo simulation programbased onGeant4. The simulation shows that the response of detector is sensitive to the light yield of LS, and the reflectivity of the reflectors and the inner surface of the stainless steel tank, and is not sensitive to the attenuation length of LS, oil and acrylic vessel if they are longer than 7m, 13m and 1m at the wavelength longer than 420nm. Nominal values of the optical parameters are set at their measured ones. After the digitization of PMT output, we get the final simulation data. Daya Bay
Phase I Comparison of data and simulation After the digitization of PMT output in simulation, we see that the simulation and experiment data have good agreement. 133Ba 137Cs 22Na 60Co The comparison of simulation and data with 133Ba,137Cs,22Na and 60Co at centre of the detector show that they agree well, and we have preliminarily understood the detector. Daya Bay
The energy to photoelectron conversion factor of the prototype at the detector centre is 286.4 P.E./MeV (left), and its resolution is 9.2%/ (MeV) (right) with 40 PMTs. Phase I Energy response linearity and resolution The detector has a good energy response and resolution. Daya Bay
Phase I Uniformity and leakage of energy To study the uniformity and position effect of the prototype, the 137Cs source is moved along the detector’s cylindrical central axis and the respective energy response is measured. The position effect of our prototype has been also preliminarily understood. The gamma catcher with ~45cm thickness will effectively reduce the energy leakage effect of gamma in the future Daya Bay detector. Daya Bay Cylindrical central axis
Phase II of prototype with GdLS At 2007.2, the prototype was refilled with GdLS: ~750L GdLS (~0.6ton, 3g/L PPO, 15mg/L bis-MSB, 0.1% Gd, 100% LAB); Change the top reflector to ESR from Al film; Daya Bay
Energy response linearity of Phase II P.E. output of phase II at the centre of detector is ~301 P.E. / MeV with 38 PMTs, which is ~11% larger than Phase I. Daya Bay
Neutron capture We use PuC as the neutron sources to calibrate the capturedneutron of the detector. Daya Bay
6.917MeV +α 3- n2 6.13MeV 6.049MeV n1 13C 0+ 17O n0 0+ 0MeV 16O 238Pu - 13C source αfrom238Pu Eα ~ 5.48 MeV α + 13C ---- 16O + n + 2.216MeV Goal: to get the eventsof 6.13MeV Gamma associated with neutron Daya Bay
Phase II PuC neutron source With associated event cuts: prompt signal, delay signal and its interval, we get: Delay signal Prompt signal In the prompt signal spectrum, there are two peaks at ~4.5 MeV and ~6.13 MeV. In the delay signal spectrum, there are also two peaks at ~2.2 MeV and ~8 MeV, which clearly shows the neutron capture by proton and Gd. Daya Bay
Phase II Interval between prompt and delay signals of PuC (neutron capture time) The peak of interval spectrum of neutron capture is at ~8us. The neutron capture time is ~26.3us fitted with exponential functions. Daya Bay
Data MC Phase II Data and simulation with Geant4 Prompt signal Delay signal The sources of the peaks in the spectra have clearly understood. The two peaks of prompt signal come from the excited 12C (~4.438MeV) + proton recoil (~0.10MeV) and the ~6.13MeV gamma. The measured nonlinearity of 8MeV and 2.2MeV peaks is ~3%. Daya Bay
Phase II data and simulation(neutron capture time) The neutron capture time spectra got from data and simulation agree with each other. Daya Bay
Gd-LS stability monitoring by prototype Place the 137Cs and 60Co at the centre of the detector to monitor the photoelectron output of the detector, totally 356days from 2/8/2007 to 1/29/2008; it shows good stability. Daya Bay
Conclusion • Validated the detector design of Daya Bay. • Preliminary understood the detector response with the geant4 MC simulation. • GdLS works properly to capture neutrons with a good stability. • PuC neutron source provides the events of 6.13MeV Gamma associated with neutron. Daya Bay