Agricultural Land Valuation
210 likes | 441 Vues
Agricultural Land Valuation. Dwight Aakre Farm Management Specialist January 2012. Valuation and Assessment of Agricultural Land. Agricultural value is defined as the “capitalized average annual gross return” Annual gross return for:

Agricultural Land Valuation
E N D
Presentation Transcript
Agricultural Land Valuation Dwight Aakre Farm Management Specialist January 2012
Valuation and Assessment of Agricultural Land • Agricultural value is defined as the “capitalized average annual gross return” • Annual gross return for: • Cropland growing sugar beets or potatoes equals 20 percent of annual gross income produced • Cropland growing all other crops equals 30 percent of annual gross income produced • Irrigated production is reduced by 50 percent before applying the 20 or 30 percent calculation • Land used for grazing equals 25 percent of annual gross income potential based upon animal unit carrying capacity of the land
Valuation & Assessment of Ag Land (continued) • Data for the most recent ten years are used with the high and low years dropped and the remaining eight years averaged • Average landlords share of gross return is divided by the capitalization rate to derive land value
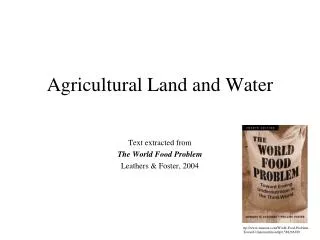
Cropland • The data needed to estimate gross revenue for cropland in each of the state’s counties are: • acreages for each of the crops grown and summer fallow in each county • yield per acre for each of the crops, and • price for each of the crops The source of data is the National Agricultural Statistics Service (NASS) of the United States Department of Agriculture, for years 2001-2009. Risk Management Agency (RMA) was used for 2010 data.
Cropland (continued) • The procedure for estimating gross revenue from crop production in each county is, for each crop, as follows: • acreage X yield per acre = production • production X price = value of production in the county for each crop • acres for summer fallow, prevent plant and all crops are summed, and • values of production for all crops are summed The results of steps 6 and 7 provide total value of crop production and total cropland acreage for each county.
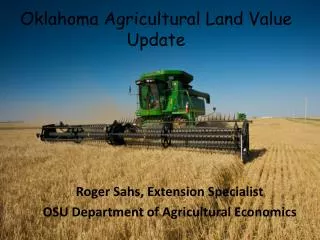
Estimating the Value of Native Rangeland and Pasture • Estimating the value of native rangeland and pasture involves estimating the value of calves and cull cows produced per acre of those lands. These estimates are based on the livestock carrying capacity, measured in animal unit months (AUMs). One AUM is assumed to be enough grazing capacity to support a 1,000 pound cow and her calf for one month.
Conservation Reserve Program (CRP) Data • The data for the CRP are from Farm Service Agency (FSA), USDA and consist of the number of acres enrolled in the CRP program, by county, and the total payments made in each county for the CRP program • One-half of the total CRP payments are entered as gross revenue from CRP
Government Program Payments Data • These data are also provided by FSA and consist of the government payments made in each county for all commodity programs (exclusive of CRP)
Capitalization Rate • The data that are used to develop the interest rate used to capitalize the landlord share of gross revenue is the set of annual average interest rates. The interest rate that is developed is based on the last 12 years, with the high year and the low year dropped, so the rate that results is the average of the ten remaining years. (Senior Asset/Liability Analyst, AgriBank, FCB, St. Paul, MN)
Minimum Capitalization Rate • The 2003 Legislature amended the capitalization rate formula, setting a minimum rate of 9.5 percent to be used when the formula rate falls below this level. • The 2005 Legislature amended the formula again, setting the minimum rate at 8.9 percent for 2005 and 8.3 percent for subsequent years. • The 2009 Legislature amended the formula, setting the minimum at 7.7 percent for 2010 and 7.4 percent for 2011, and back to the legislated formula for 2012 and beyond.
Historical Capitalization Rates Note: Numbers in parenthesis are formula rates not used
Cost of Production Index • An index of prices paid for items used for production, interest, taxes and wage rates. • Reduces the landowners share of gross return. • Reduces calculated land values. • Added to the model in 1999.
What Changes Cropland Values? • Capitalization rate • Cost of Production Index • Crop Revenue • Crop mix • Crop yields • Crop prices • Government payments • CRP payments
What Changes Non-Crop Land Values? • Capitalization Rate • Cost of Production Index • Livestock Revenue • Cull cow price • Calf price