Download
1 / 3
30 likes | 51 Vues
Heat Maps in Dynamics CRM can help you visualize a large number of data in the simplest way so that you can make sense of it.

E N D
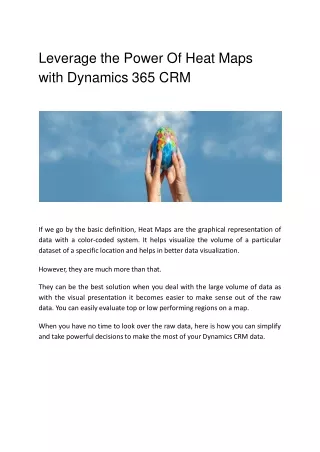
Leverage the Power Of Heat Maps with Dynamics 365CRM If we go by the basic definition, Heat Maps are the graphical representation of data with a color-coded system. It helps visualize the volume of a particular dataset of a specific location and helps in better datavisualization. However, they are much more than that. They can be the best solution when you deal with the large volume of data as with the visual presentation it becomes easier to make sense out of the raw data. You can easily evaluate top or low performing regions on amap. When you have no time to look over the raw data, here is how you can simplify and take powerful decisions to make the most of your Dynamics CRMdata.
Here is how you can use them to derive actionableinsights: Visualize a Large DataSets The other times you have to filter out the important data, with heatmaps you can have a quick overview of the whole data. Based on the color intensity, you can identify the influential factors and prepare the actionable items. With the color gradient, you get a continuous range instead of breaking the data into different ranges. This way, you can analyze the overall performance that helps you unleash the hidden opportunities, trends in yourdata. Analysis BecomesEasy Heatmaps provide a visual experience that any standard analytics report doesn’t. As there are no numbers, complex shapes, it eliminates the time-consuming process of analyzing the data. With Dynamics CRM Map Integration, sales reps get a summary card in which they can view the plotted data in the form of average or sum value. To get any specific details of any region, they just have to click onit. Users can PersonalizeThem If required, the user can add a category to filter the data. They also get an option to change the colors and set as per their preferences. Hence, analysis becomes swifter for different attributes including sales, opportunities, revenue, etc. Gives You Data That’s ActuallyRequired Instead of spending time on the endless data, with heatmaps sales reps can filter out the areas where the most attention is required. For example, if some of the areas are not churning enough revenue but they have the potential, a sales rep can set those areas as theirpriority.
Track theSuccess As time goes by, you can leverage heat maps to evaluate if your strategies are working or you need to tweak them a little. Further, you can check the factors that are causing failures in the system which can help you reinvent things. Along with that, it unclutters business data and helps you create effective strategies with bedrock data that actually make a difference to your business. OriginalBlog: https://www.appjetty.com/blog/leverage-the-power-of-heat-maps-with-dyna mics-365-crm