Download
1 / 33
330 likes | 472 Vues
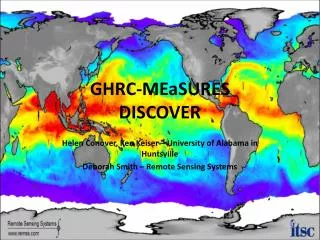
DISCOVER: Continuation via MEaSUREs. Deborah K. Smith Frank J. Wentz Marty Brewer Helen Conover Ken Keiser. D istributed I nformation S ervices: C limate/ O cean Products and V isualization for E arth R esearch ( DISCOVER ). What is DISCOVER? What products do we distribute?

E N D
DISCOVER: Continuation via MEaSUREs Deborah K. Smith Frank J. Wentz Marty Brewer Helen Conover Ken Keiser Distributed Information Services: Climate/Ocean Products and Visualization for Earth Research (DISCOVER)
What is DISCOVER? • What products do we distribute? • What format are the data products? • What services do we provide? • How are data distributed? • What will we accomplish during MEASUREs?
Distributed Information Services: Climate/Ocean Products and Visualization for Earth Research (DISCOVER) • A Science REASoN collaboration Remote Sensing Systems NASA/MSFC University of Alabama in Huntsville • 5 year project starting April 2004 • Science goals • Highly accurate long-term (decadal+) climate and ocean data sets from multiple instruments on multiple platforms • IT goals • On-line services for data access and visualization • Interoperability technologies for improved data usability • Flexible architecture to adapt to changing user requirements http://www.discover-earth.org/
A Team with an 18-Year Heritage: SSM/I Pathfinder and PM-ESIP • Frank Wentz – PI, RSS • Michael Goodman – Co-I, NASA/MSFC • Sara Graves – Co-I, UAH • Roy Spencer – Co-I, UAH • Deborah Smith – Data Production/Validation, RSS • Helen Conover – IT Technical Lead, UAH • Marty Brewer – Web and Data Management, RSS • Ken Keiser – Data Pool Development, UAH
Our Data Work Includes: • Processing microwave radiation measured by the radiometers/scatterometers to deliverable products. • Design of radiative transfer and surface emissivity models. • Geolocation (intersection of satellite looking direction with Earth surface). Needs to be very accurate (0.05 deg). • Instrument Calibration (needs to be accurate to 0.5K). • Development of algorithms for turning measurement into geophysical products. • Validation by comparison with in situ measurements such as buoys, radiosondes, ships, etc. • Monitoring of data quality • Blending products from different instruments • Microwave water vapor, winds, rain and SST merged data products. • Providing quality data to redistributors • Applying our microwave products to climate studies • Trends of winds, water vapor, SST • Closing the hydrological cycle using 20 years of SSM/I.
Unique Challenges of Satellite Data • With in situ data: worry about the instrument in the environment • No different when the instrument is in space! • Especially important when merging multi-sensor observations • Examples: • Mis-specification of SSM/I pointing geometry • Satellite attitude problems, orbital drift/decay • Emissive TMI antenna • Gradients in the AMSR-E hot load, moon reflection in cold mirror • Radio Frequency Interference reflected off sea surface • Sun glitter on the sea surface • Diurnal variability in geophysical parameters
Our Technology Development Includes: • On-line services for data access and visualization • Interoperability technologies for improved usability • Flexible architecture to adapt to changing user requirements • Technology Development Approach • Exploring new technologies appropriate for DISCOVER • Integrating new technologies into DISCOVER information system • Hardening selected technologies and making them available to the wider community http://discover.itsc.uah.edu
What is DISCOVER? • What products do we distribute? • What format are the data products? • What services do we provide? • How are data distributed? • What will we accomplish during MEASUREs?
What’s Available? • Passive Microwave • SSM/I • Wind Speed, July 1987 to the present, global • 6 Satellites: F08, F10, F11, F13, F14, F15 • TMI • Wind Speed, Dec 1997 to the present, tropics only • AMSR-E • Wind Speed, June 2002 to the present, global • Active Microwave • QuikSCAT • Wind Speed and Direction, July 1999 to the present, global • SeaWinds • Wind Speed and Direction, April through October 2003, global • LTAN SeaWinds: 10:30 PM vs QuikSCAT: 6 AM • Merged Data Products • Optimum Interpolated SSTs (OISST) • Made from TMI and AMSR-E data • Can be distributed if one of the instruments fails • Microwave Merged Water Vapor (MMWV) • 12-hour format before 1996 • 6-hour format after 1996 • Surface Wind Speeds • 6-hour format • Mad from radiometer and scatterometer winds
Microwave Ocean Data Products from Data available as: ascending/descending swaths 3-day, weekly and monthly averages merged geophysical products
Optimally Interpolated SSTs 4x daily Merged Water Vapor Daily Cumulative Rain Rate
DISCOVERing Satellite Data Trends Global Average Trend in Water Vapor: +1.2% (+0.354 mm) / decade • Water vapor accuracy: • 1.5 % instantaneously • 0.2 %/decade for long term trends Global Average Trend in wind speed: +1.0% (+0.08 m/s) /decade • Wind accuracy: • 1 m/s instantaneously • 0.05 m/s/dec for long term trends
What is DISCOVER? • What products do we distribute? • What format are the data products? • What services do we provide? • How are data distributed? • What will we accomplish during MEASUREs?
Format of DISCOVER Geophysical Products DISCOVER data are simple binary files of single byte data arrays Advantages Uniformity in all products No special reading libraries needed Will be readable in the future with any programming code Transfers easily between little-endian and big-endian systems Software in Fortran, IDL and Matlab for reading the files Space saving and quick downloads when zipped Disadvantages No metadata in file No header, so file name is the only identification Automatic reading by purchased software is limited
Integration of Domain Science and Information Technology • Information Technology Scientists • Information Science Research • Knowledge Management • Data Exploitation • Domain Scientists • Research and Analysis • Data Set Development • Collaborations • Accelerate research process • Maximize knowledge discovery • Minimize data handling • Contribute to both fields Domain Scientists Information Scientists
On-line data access with integrated data services • Automated ordering, subsetting, packaging, display and delivery of scientific data • Multiple distributed repositories at UAH and RSS • Common user interface, data catalog and order tracking • http://datapool.nsstc.nasa.gov Data Selection Visualization Order Subsetting Packaging Public FTP
Data Pool Features • Data Pool Navigation Options: • Search via keyword and geotemporal location • Browse via calendar • Browse data directories • Data Access Services: • FTP and HTTP • OPeNDAP • OGC WMS • Data Packaging Services: • Subsetting • Re-formatting • Bundling http://datapool.nsstc.nasa.gov
Integration of OGC Web Services Wilma SSM/I 19GHz View of Wilma on 21 Oct 2005 Interactive, real-time browse images through use of OGC web mapping services
Data Pool Services Interactions Find and Order Data Application Layer Packaged Files Order Broker Create Order Search Claim Order Process Order Service Layer Catalog Services DOTS Services Packaging Services Collection & Inventory Data Order Tracking System (DOTS) Data and Metadata Layer Data Repositories Harvest Metadata
Order Broker Claim Order Process Order DOTS Services Packaging Services Data Order Tracking System (DOTS) Data Repositories Distributed Services in an Evolving World • Distributed services insulate customers and applications from underlying computational systems • Use of distributed services protects applications from ripples of underlying service changes • Service use promotes the ability to scale systems across multiple repositories
What is DISCOVER? • What products do we distribute? • What format are the data products? • What services do we provide? • How are the data distributed? • What will we accomplish during MEASUREs?
Distribution of DISCOVER Geophysical Products Web and FTP Remote Sensing Systems Web site browsing ftp file download Support directory with software and data information Tropical cyclone archive GHRC Data Pool for ordering and delivery Web mapping services OPeNDAP Tropical cyclone interface Redistributors wind data used in REASoN project by Atlas/Ardizzone wind data used in NOAA blended sea winds product U Wisconsin cloud climatology U Hawaii high wind climatology AND MORE
SSM/I V6 Data Used to Produce Merged Wind Products Blended Sea Winds Available from NOAA/NCDC Hui-Ming Zhang Multi-Platform Ocean Surface Wind Velocity Product Available from PO-DAAC Joe Ardizzone and Bob Atlas
DISCOVER Applied Web Sites The Tropical Cyclone Web Sites provide interfaces useful in forecasting hurricanes and for retrospective storm studies. Both are used by the Joint Typhoon Warning Center.
What is DISCOVER? • What products do we distribute? • What format are the data products? • What services do we provide? • How are the data distributed? • What will we accomplish during MEASUREs?
Upcoming Work for MEaSUREs Data Addition of new satellites (SSMIS and WindSat) Continued improvements to algorithms Corrections for problems (such as the F15 RadCal beacon) Continued data monitoring, validation, production and distribution Production of evaporation fields Services Assistance with implementation of OPeNDAP at RSS Web Mapping services for DISCOVER data Subsetting and data translation services implemented