Download
1 / 27
280 likes | 417 Vues
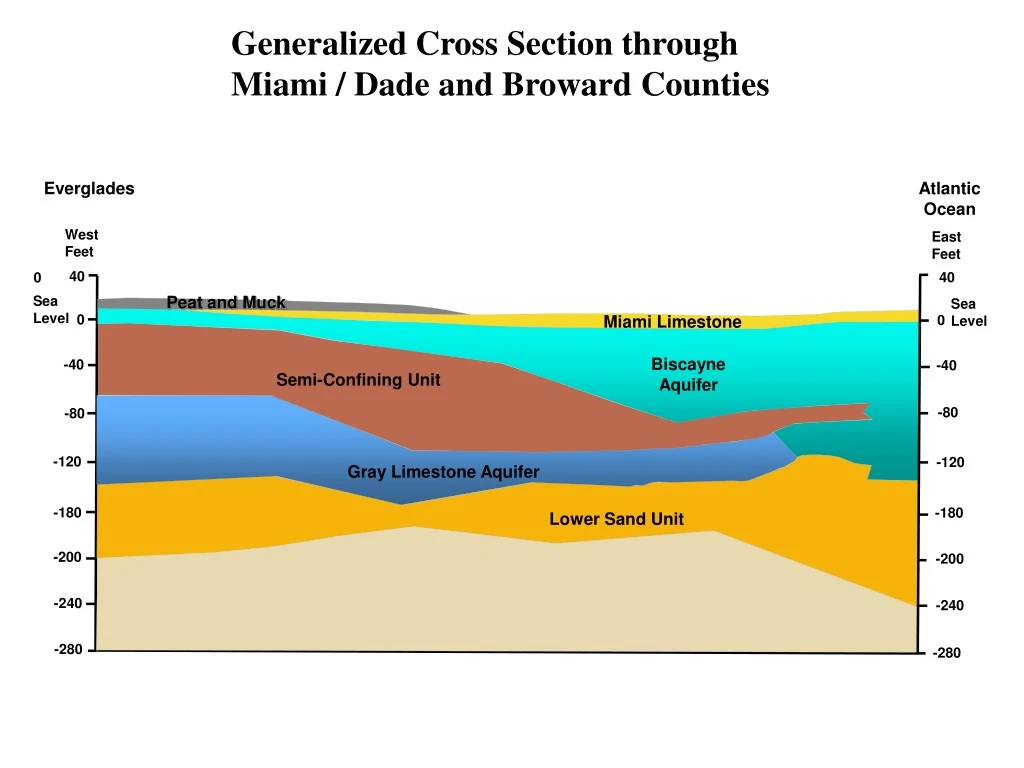
Explore the underground layers and aquifers beneath Miami/Dade and Broward Counties, including the Biscayne Aquifer, limestone formations, and water table levels. Discover the geological makeup through a detailed cross-section.

E N D
Everglades Atlantic Ocean WestFeet East Feet 40 40 0 Peat and Muck Sea Level Sea Level 0 Miami Limestone 0 Biscayne Aquifer -40 -40 Semi-Confining Unit -80 -80 -120 -120 Gray Limestone Aquifer -180 -180 Lower Sand Unit -200 -200 -240 -240 -280 -280 Generalized Cross Section through Miami / Dade and Broward Counties
Everglades Atlantic Ocean WestFeet WCA 3 East Feet 40 40 0 Peat and Muck Sea Level Sea Level 0 Miami Limestone 0 Biscayne Aquifer -40 -40 Semi-Confining Unit -80 -80 -120 -120 Gray Limestone Aquifer -180 -180 Lower Sand Unit -200 -200 -240 -240 -280 -280 Generalized Cross Section through Miami / Dade and Broward Counties
Feet Feet 40 40 Peat and Muck Miami Limestone Sea Level Sea Level 0 0 Biscayne Aquifer -40 -40 Semi-Confining Unit -80 -80 -120 -120 Gray Limestone Aquifer Lower Sand Unit -180 -180 -200 -200 -240 -240 -280 -280 Generalized Cross Section through Miami / Dade and Broward Counties Atlantic Ocean Everglades
Atlantic East Big Cypress West Feet Feet 100 100 Sea Level 0 0 Sea Level Tamiami Equiv. in LWC Biscayne Aquifer -100 -100 Grey Limestone Aquifer -200 -200 Semi-Confining Unit -300 -300 -400 -400 -500 -500 -600 -600 Intermediate Confining Unit -700 -700 -800 -800 -900 -900 -1000 -1000 -1100 -1100 -1200 Upper Floridan Aquifer -1200 -1300 -1300 Generalized Cross Section through Miami / Dade and Broward Counties
Atlantic East Big Cypress West Browad Co. C-9 Dade Co. L-28 Feet Feet L-33 C-8 L-67A WCA-3 100 100 L-67C Miami Canal C-7 Sea Level 0 0 Sea Level Tamiami Equiv. in LWC Biscayne Aquifer -100 -100 Grey Limestone Aquifer -200 -200 Semi-Confining Unit -300 -300 -400 -400 -500 -500 -600 -600 Intermediate Confining Unit -700 -700 -800 -800 -900 -900 -1000 -1000 -1100 -1100 -1200 Upper Floridan Aquifer -1200 -1300 -1300 Generalized Cross Section through Miami / Dade and Broward Counties
Atlantic East Big Cypress West Feet Feet 100 100 WCA 3 Sea Level 0 0 Sea Level Tamiami Equiv. in LWC Biscayne Aquifer -100 -100 Grey Limestone Aquifer -200 -200 Semi-Confining Unit -300 -300 -400 -400 -500 -500 -600 -600 Intermediate Confining Unit -700 -700 -800 -800 -900 -900 -1000 -1000 -1100 -1100 -1200 Upper Floridan Aquifer -1200 -1300 -1300 Generalized Cross Section through Miami / Dade and Broward Counties
Lake Okeechobee Gulf of Mexico Atlantic Ocean Lower East Coast Biscayne Aquifer Transmissivity
Lake Okeechobee Atlantic Ocean Gulf of Mexico Lower East Coast Floridan Aquifer Transmissivity
Lake Okeechobee Atlantic Ocean -120 -60 -80 -100 -40 -20 Gulf of Mexico Biscayne Aquifer Lower East Coast Biscayne Aquifer
South North Feet Feet 500 500 Sea Level Sea Level 0 0 Upper Confining Unit Upper Floridan Aquifer -500 -500 Middle Semi-Confining Unit -1000 -1000 Lower Floridan Aquifer -1500 -1500 -2000 -2000 Lower Confining Unit Confining Unit -2500 -2500 Generalized Cross Section of the Kissimmee Basin
Lake Okee. South North River Osceola Co. Okeechobee Co. Kissimmee Orange Co. Feet Feet Lake Kissimmee Lake Istokpoga Polk Co. 500 500 Sea Level Sea Level 0 0 Upper Confining Unit Upper Floridan Aquifer -500 -500 Middle Semi-Confining Unit -1000 -1000 Lower Floridan Aquifer -1500 -1500 -2000 -2000 Lower Confining Unit Confining Unit -2500 -2500 Generalized Cross Section of the Kissimmee Basin
South North Feet Feet 500 500 Sea Level Sea Level 0 0 Upper Confining Unit Upper Floridan Aquifer -500 -500 Middle Semi-Confining Unit -1000 -1000 Lower Floridan Aquifer -1500 -1500 -2000 -2000 Lower Confining Unit Confining Unit -2500 -2500 Generalized Cross Section of the Kissimmee Basin
500 500 Sea Level 0 Sea Level 0 Upper Confining Unit Upper Floridan Aquifer -500 -500 Middle Semi-Confining Unit -1000 -1000 Lower Floridan Aquifer -1500 -1500 -2000 -2000 Confining Unit -2500 -2500 Lower Confining Unit Boulder Zone Cretaceous -3000 -3000 -3500 -3500 Generalized Cross Section of the Kissimmee Basin
Kissimmee Basin Upper Floridan Aquifer Transmissivity Atlantic Ocean Lake Okeechobee
Kissimmee Basin Surficial Aquifer Atlantic Ocean Lake Okeechobee
SE NW Feet Feet 100 100 Sea Level Sea Level Water Table Aquifer 0 0 Lower Tamiami Aquifer -100 Lower Tamiami Confining Bed -100 Sandstone Aquifer Upper Hawthorn Confining Bed -200 -200 Mid-Hawthorn Confining Bed -300 -300 Mid-Hawthorn Aquifer -400 -400 -500 -500 Lower Hawthorn Confining Bed -600 -600 -700 -700 -800 -800 Upper Floridan Aquifer -900 -900 -1000 -1000 Generalized Cross-Section of the Lower West Coast Aquifers (NW to SE)
Caloosahatchee Lake Trafford Lee County Collier County SE NW Feet Feet 100 100 Sea Level Sea Level Water Table Aquifer 0 0 Lower Tamiami Aquifer -100 Lower Tamiami Confining Bed -100 Sandstone Aquifer Upper Hawthorn Confining Bed -200 -200 Mid-Hawthorn Confining Bed -300 -300 Mid-Hawthorn Aquifer -400 -400 -500 -500 Lower Hawthorn Confining Bed -600 -600 -700 -700 -800 -800 Upper Floridan Aquifer -900 -900 -1000 -1000 Generalized Cross-Section of the Lower West Coast Aquifers (NW to SE)
SE NW Feet Feet 100 100 Sea Level Sea Level Water Table Aquifer 0 0 Lower Tamiami Aquifer -100 Lower Tamiami Confining Bed -100 Sandstone Aquifer Upper Hawthorn Confining Bed -200 -200 Mid-Hawthorn Confining Bed -300 -300 Mid-Hawthorn Aquifer -400 -400 -500 -500 Lower Hawthorn Confining Bed -600 -600 -700 -700 -800 -800 Upper Floridan Aquifer -900 -900 -1000 -1000 Generalized Cross-Section of the Lower West Coast Aquifers (NW to SE)
Lower West Coast Surficial Aquifer Lake Okeechobee Gulf of Mexico
Lower West Coast Lower Tamiami Aquifer Lake Okeechobee Gulf of Mexico
NW Feet SE Feet Sea Level Sea Level 0 0 Surficial Aquifer System -100 -100 -200 -200 Upper Confining Unit for the Upper Floridan Aquifer -300 -300 -400 -400 -500 -500 -600 -600 Upper Floridan Aquifer -700 -700 -800 -800 Middle Semi-Confining Unit -900 -900 -1000 -1000 Generalized Geological Cross Section of the Upper East Coast
Martin Co. NW SE St. Lucie Co. Okeechobee Co. Feet Feet Sea Level Sea Level 0 0 Surficial Aquifer System -100 -100 -200 -200 Upper Confining Unit for the Upper Floridan Aquifer -300 -300 -400 -400 -500 -500 -600 -600 Upper Floridan Aquifer -700 -700 -800 -800 Middle Semi-Confining Unit -900 -900 -1000 -1000 Generalized Cross Section of the Upper East Coast
NW Feet SE Feet Sea Level Sea Level 0 0 Surficial Aquifer System -100 -100 -200 -200 Upper Confining Unit for the Upper Floridan Aquifer -300 -300 -400 -400 -500 -500 -600 -600 Upper Floridan Aquifer -700 -700 -800 -800 Middle Semi-Confining Unit -900 -900 -1000 -1000 Generalized Geological Cross Section of the Upper East Coast
Upper East Coast Surficial Aquifer Atlantic Ocean Lake Okeechobee
Upper East Coast Upper Floridan Aquifer Transmissivity Atlantic Ocean Lake Okeechobee
Chloride Concentration in the Upper Floridan Aquifer Atlantic Ocean Lake Okeechobee Gulf of Mexico
Generalized Transmissivity in the Upper Floridan Aquifer Atlantic Ocean Lake Okeechobee Gulf of Mexico