Download
1 / 61
610 likes | 638 Vues
Explore factors influencing legislators in a specific legislature when casting votes on bills. Includes party identification, constituent pressure, graft/corruption, alliances, and more. Utilizes observable data such as roll call votes and speeches to model explanatory factors. Investigates complexity and ideology in legislative bodies.

E N D
Partition Decoupling for Roll Call Data Scott Pauls Department of Mathematics Dartmouth College (joint work with G. Leibon, D. Rockmore and R. Savell) SFI Summer School, 2010
Voting in legislatures • A specific legislature comprised of a number of legislators face a vote on a particular bill. • How will each of the legislators vote? • What factors influence them? ?
Voting in legislatures • A specific legislature comprised of a number of legislators face a vote on a particular bill. • How will each of the legislators vote? • What factors influence them? Party identification
Voting in legislatures • A specific legislature comprised of a number of legislators face a vote on a particular bill. • How will each of the legislators vote? • What factors influence them? Constituent Pressure
Voting in legislatures A specific legislature comprised of a number of legislators face a vote on a particular bill. How will each of the legislators vote? What factors influence them? Graft/corruption
Voting in legislatures • A legislature comprised of a number of legislators face a vote on a particular bill. • How will each of the legislators vote? • What factors influence them? Logrolling, alliances, strategic voting
Voting in legislatures • A specific legislature comprised of a number of legislators face a vote on a particular bill. • How will each of the legislators vote? • What factors influence them? • Bart Stupak (D-MI) Issue oriented concerns/priorities
Voting in legislatures • A specific legislature comprised of a number of legislators face a vote on a particular bill. • How will each of the legislators vote? • What factors influence them? “family values” “ethical behavior”
Ideology in legislative bodies Observable data: • Press releases • Speeches, statements • Roll call votes • Sponsorship/sponsorship Questions: • Can we gain information on our possible factors from our observable data? • What data is “good/bad” for this purpose? What can we trust? • Are the factors static or do they change over time? • Can we turn our analysis into a model with decent explanatory ability?
Legislatures as social networks Members of the U.S. House and Senate are nodes in a social network who respond to both external and internal forces when casting their individual votes. Observables (i.e. votes) give an indirect measure of the structure of the network. Can we identify the geometric structure of the network imposed by these dynamic forces (and thus point to the forces themselves)?
Complicated vs. Complex Is this a “complex system” or merely a complicated one? Recall some of the key components of complex systems: • non-linear relationships • multiple interacting scales • no centralized control • feedback loops • memory • yet underlying simplicity
Poole-Rosenthal spatial models Poole and Rosenthal put forward a definition of ideology which we adopt in this work. Simply put, ideology is that which determines the outcome of the individual votes. “Voting is ideological when positions are predictable over a wide set of issues.” [Poole and Rosenthal, Ideology and Congress, 2004] They (and in their later work, with various coauthors) created a number of spatial models which seek to capture/describe this notion of ideology.
One dimensional spatial models • Poole and Rosenthal (1974, 1997, 2001) created a simple model, each member votes on one dimension
One dimensional spatial models • Poole and Rosenthal (1974, 1997, 2001) created a simple model, each member votes on one dimension Aye!Aye A particular vote also has an ideal point on this line (the yellow arrow). If the member’s point is to the left of the vote’s the member votes affirmatively.
One dimensional spatial models • Poole and Rosenthal (1974, 1997, 2001) created a simple model, each member votes on one dimension Nay!Aye Niche model If to the right, the member votes no.
One dimensional spatial models Remarkably, applying this model to create an optimal ordering of senate members yields a predictive model which explains >80% of votes cast. Higher dimensional models are simple to construct. Poole and Rosenthal found that, in the full history of the United States, one or two dimensional models were sufficient with only two exceptions – the end of the Era of Good Feelings and shortly before the Civil War. Interpretation: main dimension = “liberal-conservative” axis, second dimension is something else (time dependent).
Approaching roll call voting as a complex system New approach is non-spatial – it does not use the P-R paradigm Identify structure on multiple scales Use each structure to create a (simple) initial model of that scale. At each scale, we also wish to find a qualitative characterization of the structure we identify. In aggregate, the decomposition provides a description of ideology. Iterating this procedure uncovers different (possibly contradictory) aspects of ideology as well as identifies their relative strengths.
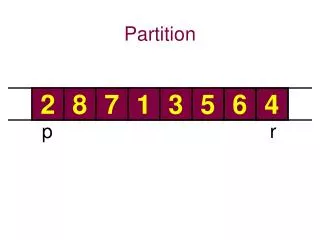
Mathematical representation We represent our system as a network – a collection of nodes and edges. In a legislative body, we take our set of nodes to be the individual legislators and connect two nodes if the associated legislators have similar voting profiles. Requires a choice of similarity between nodes: for roll call votes we use correlation between the vote vectors (-1= nay, 0=not voting, 1=yea)
Close up: one lobe of the correlation network of the 108th Senate
Degree distributions Ron Paul • These do not fit our known taxonomies. • Not scale free – indeed these have observable scales. • To varying degrees these fall into the “small world” category but mostly due to an almost complete graph in each cluster.
The Partition Decoupling Method There are two fundamental steps: • (Clustering) Isolate partition(s) of the network on one scale. This is the foundation of our approximation at this scale. • (Partition Scrubbing) Remove the effect of the partition(s) from the data. This leaves a residual data set on which we may repeat the process.
Partition Decoupling Method (PDM) Clustering • Spectral Clustering • Clustering using eigenvectors of the graph Laplacian • Significant eigenvectors give coordinates in a (high dimensional) space • Use k-means to cluster in this space • Two parameters: # of clusters, # of significant eigenvalues.
Graph Laplacian The graph Laplacian holds significant information concerning the geometry of the network. Examples: • The number of zero eigenvalues equals the number of connected components • The smallest non-trivial eigenvalue (the Fiedler value) is a measure of connectivity. • e.g. The Fiedler value gives bounds on the isoperimetric dimension of the graph, it relates to synchronization, percolation, etc. • The Fiedler value gives a coarse description of geometry of the network.
Graph Laplacian and the NCut problem Given a graph with vertices V, edges E, and a partition of the graph into two pieces A and B, we measure the cut of the graph by We seek to find the (A,B) pair which minimizes the cut.
Graph Laplacian and the NCut problem The normalized cut problem (NCut) minimizes a normalized version of the cut: where Solving this exactly is NP hard. However, the first nontrivial eigenvector of the graph Laplacian gives a solution to the relaxed version of the NCut problem.
Parameter estimation Number of significant eigenvalues • Random model: permute each vote by a random permutation. • Compute Fiedler value • Take minimum of Fiedler value over many instances Number of clusters • Fitting a mixture of Gaussians to Fiedler vector distribution (i.e. peak counting). • Cluster persistence • Cluster stability
Information from the Fiedler vector MW NE S SW W
PDM Scrubbing For each cluster, we create the mean time series of the cluster, . Projecting all (original) time series, ,onto the space spanned by the mean time series yields an approximation of the original data which captures the given partition’s structure.
PDM Scrubbing The residual time series may then be analyzed for additional structure. where
Partition decomposition: Overview • In general, we computed two layers for each Congress. • The first layer reflected the basic results of Poole-Rosenthal: the major component of ideology is simply party identification. • Evidence: almost all clusters were partisan. • Second layer: • Highest correlations: members of the same party from similar geographic regions. • Significant number of legislators (and whole legislatures) had residual votes without detectable structure (i.e. the first layer data explains almost everything). • New partition reflects issue oriented motives but cutting across party lines.
Comparison: all votes from first to 109th Congresses APRE(model)=(# errors of base model - # errors)/(# errors of base model) (APRE= aggregate proportional reduction in error)
Example: 108th House Blue Dog Democrats Pictures are generated using multi dimensional scaling (MDS)
Example: 108th Senate Sessions, Kyl, Cornyn, Santorum, etc. “Moderate Republicans”: e.g. Snowe, Chaffee, Collins, Specter, etc. “Conservative Republicans” Frist, Lott, Brownback, Hagel, etc. Fitzgerald, Gregg, McCain, Sununu, Warner Zell Miller (D-GA) “Liberal Democrats”: e.g. Kennedy, Feingold, Boxer, Leahy, Reed, etc. “Conservative Democrats”: e.g. Pryor, Lincoln, Bayh, Breaux, Landrieu, etc.
Example: 88th Senate Outer shape: red=midwest, blue=northeast, green=south,black=southwest, yellow=west Party Civil Rights
Individual errors: 108th Senate • While the overall percentage of error of the approximation is 6.5%, individuals may have significantly higher or lower percentages. Senators McCain, Feingold, Hollings, Specter, Jeffords, Carper, Bayh, Baucus, Breaux, B. Nelson, Chafee Senators J. Kerry, Bunning, Sarbanes, Edwards, Craig, McConnell, D. Nickles, Allard, Cochran, Hatch
Distinguishing clusters • The AdaBoost algorithm isolates elements of the data (i.e. votes) which best define the boundaries of clusters. • These votes reflect the motives which distinguish the clusters.
Distinguishing clusters: 108th Senate • Coarse picture: one dimensional ideology (“liberal conservative”). Democrats Republicans
Distinguishing clusters 108th Senate • Coarse picture: one dimensional ideology (“liberal conservative”). An amendment to an appropriations bill which would eliminate tax cuts. Democrats Republicans
Distinguishing clusters 108th Senate • Coarse picture: one dimensional ideology (“liberal conservative”). An amendment to repeal authorities and requirements for a base closure Democrats Republicans
Distinguishing clusters 108th Senate • Coarse picture: one dimensional ideology (“liberal conservative”). • Three votes: • Sense of the Congress re: global AIDS funding • Cloture: Safe, Accountable, Flexible and Efficient Transportation Act of 2004 • Amendment to provide a brownfields demonstration for qualified green/sustainable design projects Democrats Republicans
Distinguishing clusters 108th Senate • Coarse picture: one dimensional ideology (“liberal conservative”). • Two votes: • Extend Unemployment Benefits • Sense of the Senate re: imposition of an excise tax on tobacco lawyer’s fees that exceed $20,000/hr Democrats Republicans
Distinguishing clusters 108th Senate • Coarse picture: one dimensional ideology (“liberal conservative”). Amendment to protect US workers from foreign competition for performance of Federal and State contracts. Democrats Republicans
Distinguishing clusters 108th Senate • Coarse picture: one dimensional ideology (“liberal conservative”). Amendment to vest sole jurisdiction over Federal budget process in the Committee on the Budget Democrats Republicans
Distinguishing clusters: 88th Senate • Four amendments to the Civil Rights Act of 1964 • Passage of the Civil Rights Act of 1964 • The Gore Amendment to the Social Security Act, authorizing and funding the creation of Medicare. • An amendment to the Mass Transportation Act, deleting all funding for mass transit. • Passage of the Area Redevelopment Act Each of these votes distinguishes between the two Democratic clusters with the Northern and Southern Democrats on opposite sides of each vote. In general, the Republican cluster votes with the Southern Democratic cluster with two exceptions. First, on the Passage of the Civil Rights Act, 54% of the Republican cluster voted with the Northern Democrats for passage. Second, on the Area Redevelopment Act, 100% of the Northern Democrats and 47% of the Southern Democrats voted for passage while every member of the Republican cluster voted against.
Layer two • Regional identification dominates highest correlations (particularly in recent years). • Clustering on the residual data provides a new partition of network which is (often) completely different than the first layer. • In particular, clusters are not dominated by party identification.
Example: 108th Senate Three clusters of mixed party. Four sets of issues distinguish the clusters effectively: • Infrastructure: Three amendments (86, 214 and 230) to H.J. Res. 2, the Appropriations Bill, relating to infrastructure projects. • Energy: Seven amendments (515, 843, 844, 851, 853, 856, 884 and 1386) to Senate Bill 14, a bill concerning the energy security of the United States. One amendment (272) to S. Con. Res. 23, relating to drilling in the Arctic National Wildlife Refuge. • Homeland Security: Two amendments (515 and 3631) pertaining to Homeland Security. • Trade: The passage of the US-Chile Free Trade Agreement The first and second clusters are well separated by the Energy votes, the first and third by Energy and Infrastructure votes and the second and third by one energy vote, Homeland Security and Trade votes.