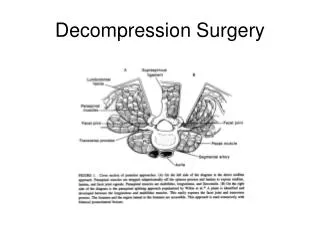
Decompression Theories, Models & Tables
Decompression Theories, Models & Tables. Karl E. Huggins USC Catalina Hyperbaric Chamber Wrigley Marine Science Center Catalina Island, CA. Missions of the USC Catalina Hyperbaric Chamber. Treatment of Scuba Diving Casualties

Decompression Theories, Models & Tables
E N D
Presentation Transcript
DecompressionTheories, Models & Tables Karl E. Huggins USC Catalina Hyperbaric Chamber Wrigley Marine Science Center Catalina Island, CA
Missions of theUSC Catalina Hyperbaric Chamber • Treatment of Scuba Diving Casualties • Educational Programs focused on Promotion of Scuba Diving Safety, Accident Response, and Treatment • Reporting Information on Diving Accidents and Diving Practices • Hyperbaric / Diving Research • Equipment Testing
Location of the Chamber • USC Wrigley Marine Science Center • Big Fisherman Cove • West End of Catalina Island • Near Two Harbors • Isolated Location • Rugged Terrain • Where the Divers Are
Popular Dive Sites within Minutes of Catalina Hyperbaric Chamber Lion’sHead EmeraldCove Ship Rock Eagle Reef Bird Rock IsthmusReef Blue Cavern
USC Catalina Hyperbaric Chamber Where Do the Patients Come From?
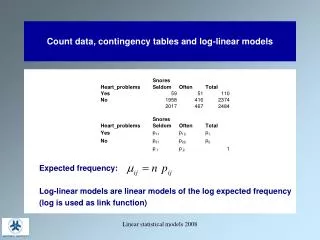
Decompression Models,Tables & Computers What do they do? What don’t they do?
The Case of the ShrinkingNo-Stop Times(100 fsw No-Stop Limit - mid 1980s) 25 min. - U.S. Navy 20 min. – NAUI / PADI / HUGI / BSAC 18 min. - Suunto SME-ML 17 min. - German Tables 15 min. - DCIEM Tables (Canada) 12 min. - Dacor Microbrain 11 min. - Dacor Microbrain Pro Plus 9 min. - Tekna Computek 8 min. - 1% Maximum Likelihood Tables
PREVENTDecompression Sickness Symptoms resulting from the evolution and growth of gas bubbles in the body fluids and tissues, following a reduction in ambientpressure. DCS The BENDS Caissons Disease
BUBBLE FORMATION BLOOD VESSEL OBSTRUCTION TISSUE DISTORTION & DISRUPTION DCS PATHOPHYSIOLOGY Platelet Aggregation Arterial Thrombosis Fibrinolysis Venous Clotting Slugging of Venous Blood Plasma Loss
Decompression SicknessVicious Cycle Bubbles Form Decreased Elimination of Gas Decreased Blood Flow Edema Tissue Hypoxia
Blow-Ups From Deep Dives A 44-year-old male scuba diver died shortly after a solo dive in great depth. He used a dry diving suit and breathed Trimix diving gas with a composition of 9.3% oxygen, 53.4% helium, and 33.9% nitrogen. According to witness state-ments, he literally spurted out of the water, making movements with his arms and rapidly losing conscious-ness. After being rescued by diving colleagues, he suffered a cardiopulmonary arrest. Resuscitation attempts were futile. Analysis of the diving computer showed a diving depth of 100 to 125 m and a diving duration of 25 min. Thomas Plattner, et. al., J Forensic Sci, November 2003
Decompression TermsSATURATIONExists when:The nitrogen pressure in the tissueis equal to the nitrogen pressure in the breathing gas.
Dive to 80 fsw Nitrogen in Breathing Gas 80 fsw + 33 fsw = 113 fsw absolute x 0.79 (N2 fraction) = 89.3 fswNitrogen Pressure in breathing gas Nitrogen in Body Tissues 0 fsw + 33 fsw = 33 fsw absolute x 0.79 (N2 fraction) = 26.1 fswNitrogen Pressure in body tissues Nitrogen Gradient
Nitrogen Pressure over Tissue RangeBody Saturated at Surface (1 ata) Fast Slow Tissues
Nitrogen Pressure over Tissue RangeBody at 33 fsw (2 ata) Fast Slow Tissues
Nitrogen Pressure over Tissue RangeBody at 33 fsw (2 ata) Fast Slow Tissues
Nitrogen Pressure over Tissue RangeBody at 33 fsw (2 ata) Fast Slow Tissues
Nitrogen Pressure over Tissue RangeBody at 33 fsw (2 ata) Fast Slow Tissues
Nitrogen Pressure over Tissue RangeBody Saturated at 33 fsw (2 ata) Fast Slow Tissues
Nitrogen Pressure over Tissue RangeBody at Surface (1 ata) after33 fsw (2 ata) Saturation Fast Slow Tissues
Nitrogen Pressure over Tissue RangeBody at Surface (1 ata) after33 fsw (2 ata) Saturation Fast Slow Tissues
Nitrogen Pressure over Tissue RangeBody at Surface (1 ata) after33 fsw (2 ata) Saturation Fast Slow Tissues
Nitrogen Pressure over Tissue RangeBody Re-Saturated at Surface (1 ata) after33 fsw (2 ata) Saturation Fast Slow Tissues
Decompression TermsSUPERSATURATIONExists when:The nitrogen pressure in the tissueexceeds the total ambient pressureexerted on the body.PtN2 > Pamb
N2 1.58 ATA PT > PN2 OFFGASSING PT > PA SUPER- SATURATION N2 N2 1.58 ATA .79 ATA PT < PN2 PT = PN2 SATURATED SATURATE AT 33 FSW ON-GASSING PT < PA PT < PA N2 SEA LEVEL .79 ATA PA = 1.0 ATA PT = PN2 SATURATED PN2 = 0.79 ATA PT < PA PT = TISSUE N2 PRESSURE 33 FSW PA = 2.0 ATA PN2 = 1.58 ATA
Shallow SupersaturationStudy Depth (fsw) # Of Divers Percent of Divers with Corresponding VGE Score 0 1 2 3 4 12.0 25 80.0% 16.0% 4.0% 0.0% 0.0% 16.0 54 44.4% 22.2% 16.7% 14.8% 1.9% 20.5 32 28.1% 21.9% 15.6% 15.6% 18.8% Eckenhoff - 1990
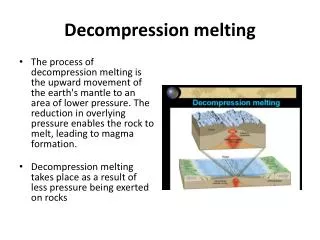
Early 1900sLinear Decompression100 fsw / 20 min. – 1 ata / 20 min.
HALDANE CONCEPT- - - - NUCLEI ARE NOT PRESENT PRIOR TO DECOMPRESSION Bubbles spontaneously form
Decompression TermsCRITICALSUPERSATURATIONThe maximum nitrogen tissuepressure tolerated at any giventotal ambient pressureExpressed as a ratio of PtN2 to PambCRITICAL RATIO = PtN2 / Pamb
N2 Haldane’s Assumption PT/PA > S.S. RATIO Nitrogen bubbles form in the body PT/PA < S.S. RATIO Nitrogen eliminated though lungs
Haldane’s Observations Supersaturation Ratio 1.58/1 Sea Level (1 ATA) N2 Pressure = 1.58 ATA 33 fsw (2 ATA) Saturation Time Goats – 3 hours Man – 5 hours
Haldane’s Observations Sea Level (1 ATA) Supersaturation Ratio 3.95/2.5 or 1.58/1 49.5 fsw (2.5 ATA) N2 Pressure = 3.95 ATA 132 fsw (5 ATA) Saturation Time Goats – 3 hours Man – 5 hours
J.S. HaldaneDecompression Model Calculations100 fsw / 20 min. OK @ 40 fsw OK @ 30 fsw 5-min N2 pressure = 3.03 ATA 3.03 ATA / 1.58 = 1.92 ATA (1.92 ATA – 1 ATA) x 33 fsw/ATA = 30.3 fsw FIRST STOP AT 40 FSW
J.S. HaldaneDecompression Model Calculations40 fsw / 1 min. OK @ 30 fsw 5-min N2 pressure = 2.87 ATA 2.87 ATA / 1.58 = 1.82 ATA (1.82 ATA – 1 ATA) x 33 fsw/ATA = 26.9 fsw OK TO ASCEND TO 30 FSW
J.S. HaldaneDecompression Model Calculations30 fsw / 3 min. OK @ 20 fsw 5-min N2 pressure = 2.41 ATA 2.41 ATA / 1.58 = 1.53 ATA (1.53 ATA – 1 ATA) x 33 fsw/ATA = 17.3 fsw OK TO ASCEND TO 20 FSW
J.S. HaldaneDecompression Model Calculations20 fsw / 5 min. 10-min pressure = 2.02 ATA 2.02 ATA / 1.58 = 1.28 ATA (1.28 ATA– 1 ATA) x 33 fsw/ATA = 9.2 fsw OK TO ASCEND TO 10 FSW OK @ 10 fsw
J.S. HaldaneDecompression Model Calculations10 fsw / 11 min. 20-min N2 pressure = 1.57 ATA 1.57 ATA / 1.58 = 0.99 ATA (0.99 ATA – 1 ATA) x 33 fsw/ATA = -0.2 fsw OK TO ASCEND TO SURFACE OK @ Surface
J.S. HaldaneDecompression Model Calculations100 fsw / 20 min.